

Question: A plot such as the example sketch of Fig. D4.8 shows the range of values of two parameters (K_{1}) and (K_{2}) for which a system
A plot such as the example sketch of Fig. D4.8 shows the range of values of two parameters \(K_{1}\) and \(K_{2}\) for which a system is stable. It is called a stability boundary diagram. Draw such a diagram for a system with characteristic equation.
\[
s^{2}+\left(6+0.5 \mathrm{~K}_{1}ight) s+3\left(\mathrm{~K}_{1}+\mathrm{K}_{2}ight)=0
\]
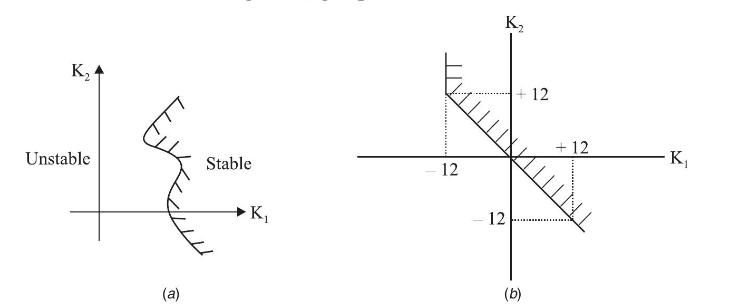
K Unstable (a) Stable K (TTXXX TX 12 K 12 +12 (b) + 12 -K
Step by Step Solution
★★★★★
3.41 Rating (157 Votes )
There are 3 Steps involved in it
1 Expert Approved Answer
Step: 1 Unlock

Question Has Been Solved by an Expert!
Get step-by-step solutions from verified subject matter experts
Step: 2 Unlock
Step: 3 Unlock