

Question: Determine the transfer function model of systems with asymptotic (d B) plots shown in Fig. P6.15(a), (b), (c), (d) and (e). Assume minimum phase characteristics
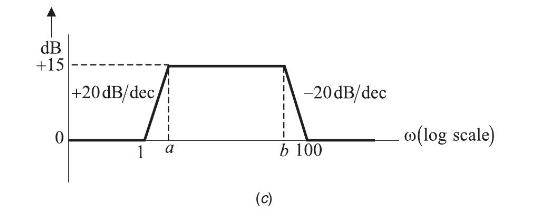
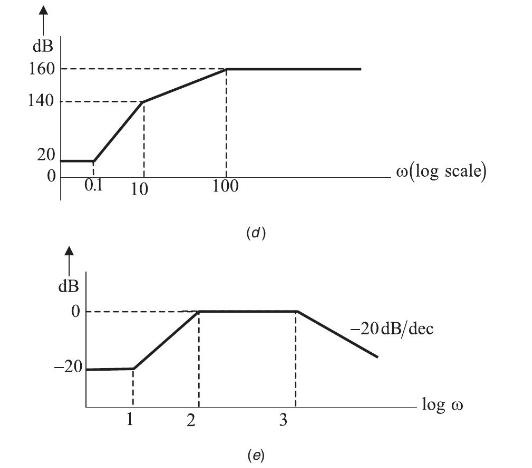
Determine the transfer function model of systems with asymptotic \(d B\) plots shown in Fig. P6.15(a), (b), (c), (d) and (e). Assume minimum phase characteristics possessed by each system.
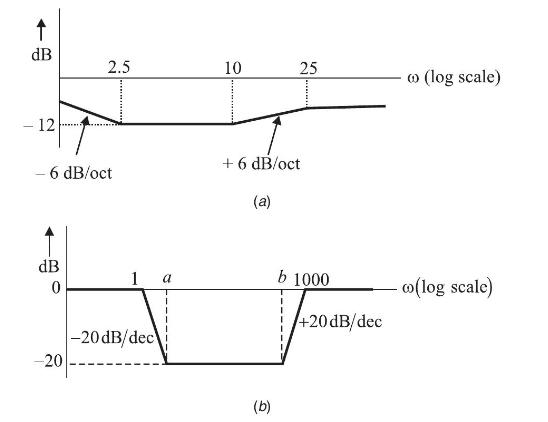
dB - 12 6 dB/oct dB 0 2.5 -20 1 -20 dB/dec 10 +6 dB/oct (a) 25 (b) b 1000 +20dB/dec @ (log scale) co(log scale)
Step by Step Solution
3.37 Rating (166 Votes )
There are 3 Steps involved in it
The provided figures are Bode magnitude plots in dB showing the frequency response of different systems By examining the slope and the breakpoints of the plots we can infer the type of transfer functi... View full answer

Get step-by-step solutions from verified subject matter experts