

Question: The Nyquist plot of the open loop transfer function of a feedback control system is shown in the figure below. If the open loop poles
The Nyquist plot of the open loop transfer function of a feedback control system is shown in the figure below. If the open loop poles and zeros are all located in the left half of the \(s\) plane, then the number of closed loop poles in the right half of the \(s\) plane will be
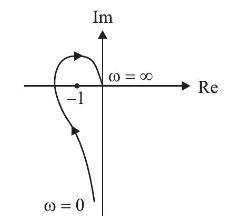
(a) zero
(b) 1
(c) 2
(d) 3
Re 0 = (0) Im 0=0 -1
Step by Step Solution
★★★★★
3.34 Rating (148 Votes )
There are 3 Steps involved in it
1 Expert Approved Answer
Step: 1 Unlock

The Nyquist plot youve provided is a graphical representation of the frequency response of a control ... View full answer
Question Has Been Solved by an Expert!
Get step-by-step solutions from verified subject matter experts
Step: 2 Unlock
Step: 3 Unlock