

Figure P4.27 illustrates the results of an open-loop step-response experiment performed on a parabolic trough collector setup
Question:
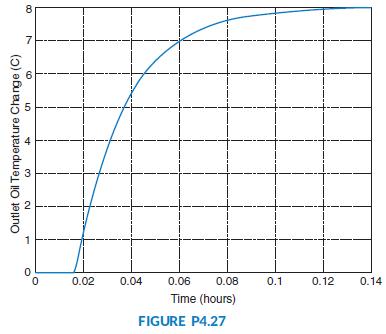
Figure P4.27 illustrates the results of an open-loop step-response experiment performed on a parabolic trough collector setup (Camacho, 2012). In this experiment, the fluid flow on the system is suddenly decreased 1 liter/sec at t = 0 hours, resulting in a temperature increase as shown in Figure P4.27. Use the figure to find an approximate transfer function for the system.
Fantastic news! We've Found the answer you've been seeking!
Step by Step Answer:

Answered By
Danish Sohail
My objective is to become most reliable expert for clients. For last 10 years I have been associated with the field of accounting and finance. My aim is to strive for best results and pay particular attention to client needs. I am always enthusiastic to help clients for issues and concerns related to business studies. I can work on analysis of the financial statements, calculate different ratios and analysis of ratios. I can critically evaluate stock prices based on the financial analysis and valuation for companies using financial statements of the business entity being valued with use of excel tools. I have expertise to provide effective and reliable help for projects in corporate finance, equity investments, financial accounting, cost accounting, financial planning, business plans, marketing plans, performance measurement, budgeting, economic research, risk assessment, risk management, derivatives, fixed income investments, taxation, auditing, and financial performance analysis.
78+ Reviews
112+ Question Solved
Related Book For 

Question Posted:
