

Look at Table 10.1 and Figure 10.7 in the text. When were T-bill rates at their highest
Question:
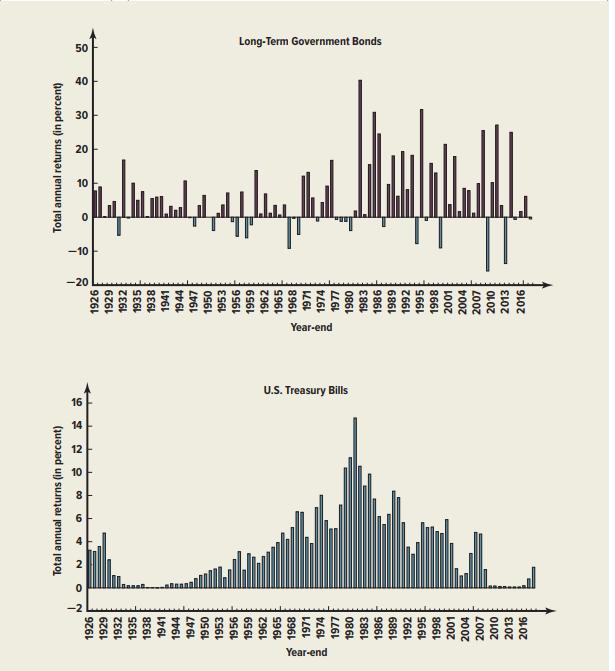
Look at Table 10.1 and Figure 10.7 in the text. When were T-bill rates at their highest over the period from 1926 through 2018? Why do you think they were so high during this period? What relationship underlies your answer?
Table 10.1
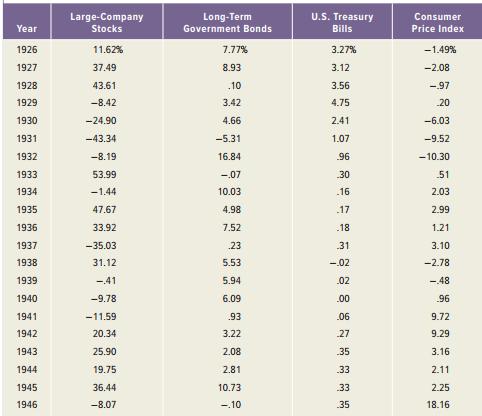
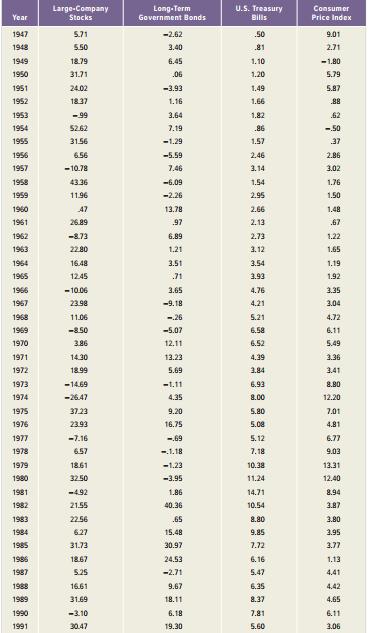
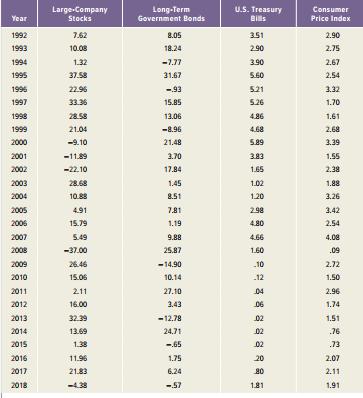
Figure 10.7
Fantastic news! We've Found the answer you've been seeking!
Step by Step Answer:
Tbill rates were highest ...View the full answer

Answered By
Amar Kumar Behera
I am an expert in science and technology. I provide dedicated guidance and help in understanding key concepts in various fields such as mechanical engineering, industrial engineering, electronics, computer science, physics and maths. I will help you clarify your doubts and explain ideas and concepts that are otherwise difficult to follow. I also provide proof reading services. I hold a number of degrees in engineering from top 10 universities of the US and Europe.
My experience spans 20 years in academia and industry. I have worked for top blue chip companies.
1+ Reviews
10+ Question Solved
Related Book For 
Corporate Finance Core Principles And Applications
ISBN: 9781260571127
6th Edition
Authors: Stephen Ross, Randolph Westerfield, Jeffrey Jaffe, Bradford Jordan
Question Posted:
