1. Using the data from 2022 in Exhibit 9.1, create an Excel spreadsheet to provide a sensitivity...
Question:
1. Using the data from 2022 in Exhibit 9.1, create an Excel spreadsheet to provide a sensitivity analysis of the effect on operating profit of potential changes in demand for HFI Inc., ranging from a 20 percent decrease to a 20 percent increase. Use Exhibits 9.2 and 9.6 as a guide. Assume that two-thirds of fixed costs are manufacturing related; the remaining one-third are selling-related. The variable manufacturing cost per unit is $30, while the variable selling cost per unit is $5.
2. Using the spreadsheet you created, compute the new operating profit assuming a 10% decrease in demand.
3. Use the Goal Seek tool within Excel to determine the sales price per unit that would allow HFI to earn an operating profit of $100,000, assuming that all the other cost information is the same as in Exhibit 9.1. Use Exhibit 9.5 as a guide.
Exhibit 9.5
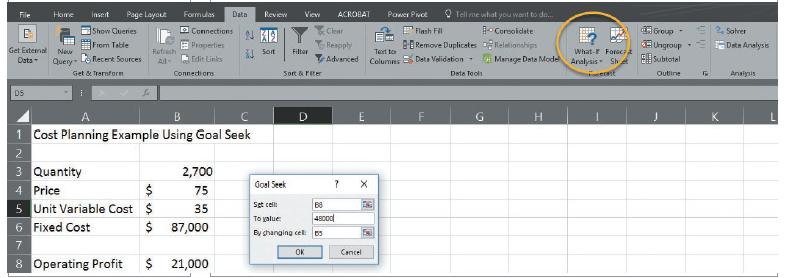
Exhibit 9.1
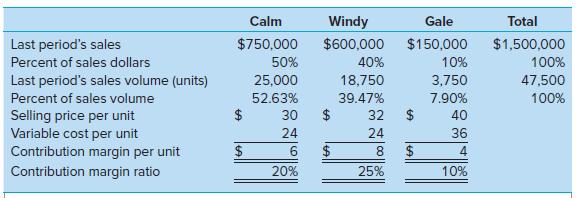
Exhibit 9.2:
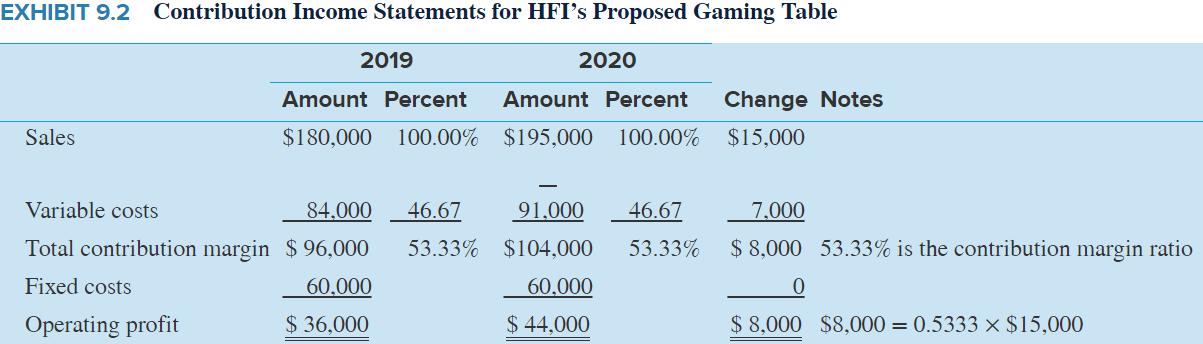
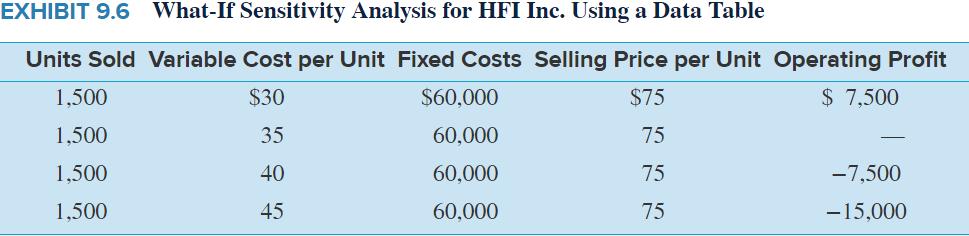
Exhibit 9.6:
Step by Step Answer:
ANSWER 1 Sensitivity Analysis Unit Sold Basis Variable cost Fixed Selling Pr...View the full answer