

Question: According to Exhibit 4-8, which is the best chart for showing a distribution of a single variable, like height? How about hair color? Major in
According to Exhibit 4-8, which is the best chart for showing a distribution of a single variable, like height? How about hair color? Major in college?
Exhibit 4-8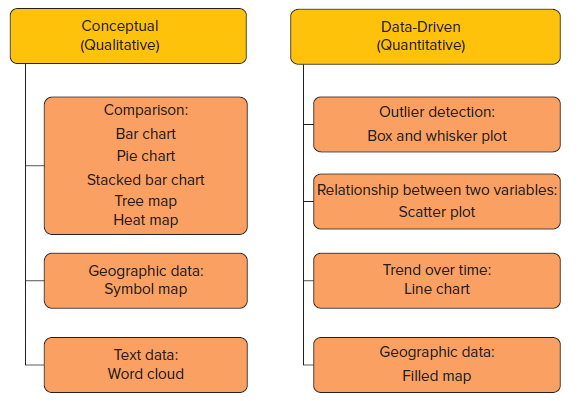
Conceptual (Qualitative) Data-Driven (Quantitative) Comparison: Outlier detection: Bar chart Box and whisker plot Pie chart Stacked bar chart Relationship between two variables: Tree map Scatter plot Heat map Trend over time: Geographic data: Symbol map Line chart Geographic data: Text data: Word cloud Filled map
Step by Step Solution
3.52 Rating (166 Votes )
There are 3 Steps involved in it
Single variables allow distribution among values or composition among ca... View full answer

Get step-by-step solutions from verified subject matter experts