

Question: Explain Exhibit 4-2 and why these four dimensions are helpful in describing information to be communicated? Exhibit 4-2 lists conceptual and data-driven as being on
Explain Exhibit 4-2 and why these four dimensions are helpful in describing information to be communicated? Exhibit 4-2 lists conceptual and data-driven as being on two ends of the continuum. Does that make sense, or can you think of a better way to organize and differentiate the different chart types?
Exhibit 4-2
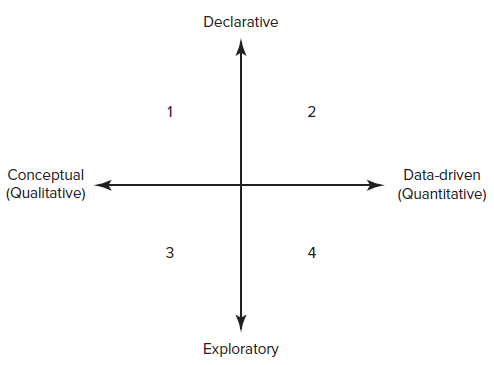
Declarative Conceptual (Qualitative) Data-driven (Quantitative) 3 4 Exploratory
Step by Step Solution
★★★★★
3.50 Rating (173 Votes )
There are 3 Steps involved in it
1 Expert Approved Answer
Step: 1 Unlock

There are four ways an analyst can visualize data depending on the intended use of the dat... View full answer
Question Has Been Solved by an Expert!
Get step-by-step solutions from verified subject matter experts
Step: 2 Unlock
Step: 3 Unlock