

Question: In financial and scientific data analysis applications, such as in spotting trends in stocks, we are often interested in making sense of noisy or highly
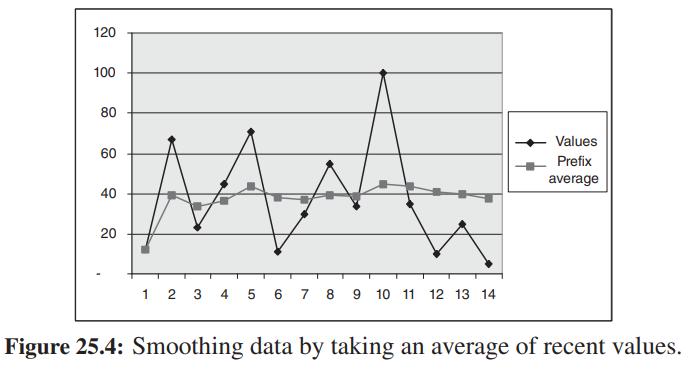
In financial and scientific data analysis applications, such as in spotting trends in stocks, we are often interested in making sense of noisy or highly fluctuating data. One method to achieve this goal is to take an average of recent values, as shown in Figure 25.4. For instance, in using a weighted moving average, one begins by specifying a sequence of m weights, W = (w0, w1,...,wm−1), with
Typically, one chooses the weights so that wi > wi+1, for i = 1,...,n − 1, so as to give greater emphasis to recent data. Then, given a sequence of n ≥ m data values, X = (x0, x1,...,xn−1), the ith value of the weighted moving average is computed as
Ai = w0ai + w1ai−1 + w2ai−2 + ··· .
For example, if W = (0.5, 0.3, 0.2) and the three most recent data values were 136, 150, 200, then the current weighted moving average would be
Ai = 0.5(136) + 0.3(150) + 0.2(200) = 153,
which is closer to 136 than it is to 200. Given the sequences W and X, as specified above, describe an efficient method for computing all the Ai values, for i = 0, 1,...,n − 1, using O(n log n) arithmetic operations.
-1 W; = 1 i=0
Step by Step Solution
3.47 Rating (163 Votes )
There are 3 Steps involved in it
To efficiently compute all the Ai values using On log n arithmetic operations we can use a technique ... View full answer

Get step-by-step solutions from verified subject matter experts