

An experiment is run in a chemical process using a 32 factorial design. The design factors are
Question:
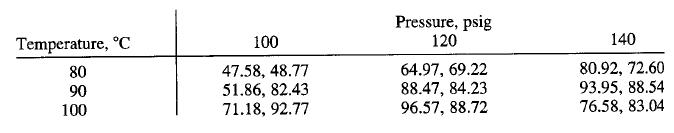
An experiment is run in a chemical process using a 32 factorial design. The design factors are temperature and pressure, and the response variable is yield. The data that result from this experiment are shown below:
(a) Analyze the data from this experiment by conducting an analysis of variance. What conclusions can you draw?
(b) Graphically analyze the residuals. Are there any concerns about underlying assumptions or model adequacy?
(c) Verify that if we let the low, medium, and high levels of both factors in this design take on the levels - 1, 0, and +1, then a least squares fit to a second-order model for yield is

(d) Confirm that the model in part (c) can be written in terms of the natural variables temperature (T) and pressure (P) as

(e) Construct a contour plot for yield as a function of pressure and temperature. Based on examination of this plot, where would you recommend running this process?
Step by Step Answer:

This question has not been answered yet.
You can Ask your question!


