

Use the regression model in part (c) of Problem 6-12 to generate a response surface contour plot
Question:
Use the regression model in part (c) of Problem 6-12 to generate a response surface contour plot for epitaxial layer thickness. Suppose it is critically important to obtain layer thickness of 14.5 Am. What settings of arsenic flow rate and decomposition time would you recommend?
Problem 6-12
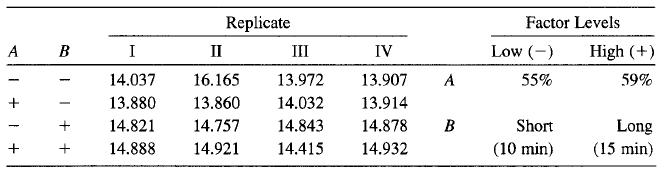
An article in the AT&T Technical Journal (March/April 1986, Vol. 65, pp. 39-50) describes the application of two-level factorial designs to integrated circuit manufacturing. A basic processing step is to grow an epitaxial layer on polished silicon wafers. The wafers mounted on a susceptor are positioned inside a bell jar, and chemical vapors are introduced. The susceptor is rotated and heat is applied until the epitaxial layer is thick enough. An experiment was run using two factors: arsenic flow rate (A) and deposition time (B). Four replicates were run, and the epitaxial layer thickness was measured (in tun). The data are shown below:
Step by Step Answer:
Solving equations this equation to find the appropriate levels of A ...View the full answer


