

Question: Use Table 2.1 to construct what is known as a Kuznets ratio (named after the economist and historian Simon Kuznets): the ratio of incomes earned
Use Table 2.1 to construct what is known as a Kuznets ratio (named after the economist and historian Simon Kuznets): the ratio of incomes earned by the richest 20% of the population to the those earned by the poorest 40% of the population. If incomes were distributed almost equally, what value would you expect this ratio to assume? What values do you see? In the sample represented by Table 2.1, do you see a trend as we move from poor to rich countries?
Table 2.1
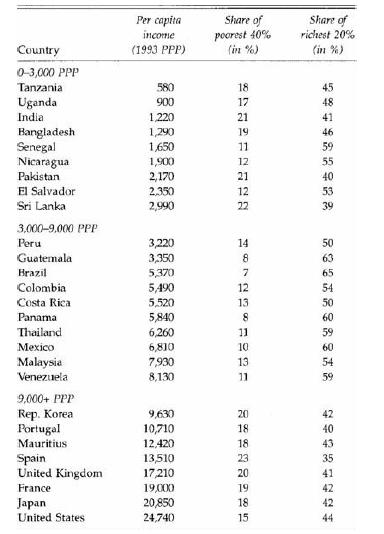
Country 0-3,000 PPP Tanzania Uganda India Bangladesh Senegal Nicaragua Pakistan El Salvador Sri Lanka 3,000-9,000 PPP Peru Guatemala Brazil Colombia Costa Rica Panama Thailand Mexico Malaysia Venezuela 9,000+ PPP Rep. Korea Portugal Mauritius Spain United Kingdom France Japan United States Per capita income (1993 PPP) 580 900 1,220 1,290 1,650 1,900 2,170 2.350 2,990 3,220 3,350 5,370 5,490 5,520 5,840 6,260 6,810 7,930 8,130 9,630 10,710 12,420 13,510 17,210 19,000 20,850 24,740 Share of poorest 40% (in %) 18 17 21 19 11. 12 21 12 22 14 8 7 12 13 8 11 10 13 11 SEFNSERD 20 18 18 23 20 19 18 15 Share of richest 20%. (in %) 45 55 55 40 5 39 48 41 46 59 53 50 SISSSSSSS 63 65 54 50 60 59 60 54 59 2 0 5 35 4 224 $5058665 42 40 43 41 44
Step by Step Solution
3.36 Rating (146 Votes )
There are 3 Steps involved in it
To construct the Kuznets ratio which represents the ratio of incomes earned by the richest 20 of the ... View full answer

Get step-by-step solutions from verified subject matter experts