

Question: Using the pets.sav data from Chapter 4 (Task 6), plot two error bar charts comparing scores when having a fish or cat as a pet
Using the pets.sav data from Chapter 4 (Task 6), plot two error bar charts comparing scores when having a fish or cat as a pet (x-axis): one for the animal liking variable and the other for the life satisfaction.
Chapter 4 Task 6
I wondered whether a fish or cat made a better pet. I found some people who had either fish or cats as pets and measured their life satisfaction and how much they like animals. Enter these data into SPSS and save as pets.sav.
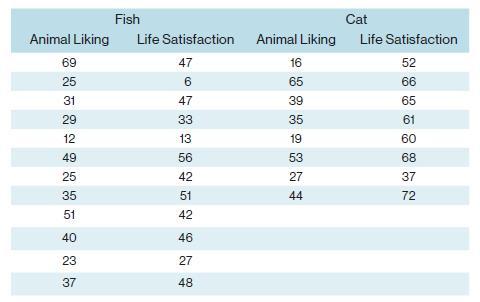
Fish Cat Animal Liking Life Satisfaction Animal Liking Life Satisfaction 69 47 16 52 25 6 65 66 31 47 39 65 29 33 35 61 12 13 19 60 49 56 53 68 25 42 27 37 35 51 44 72 51 42 40 46 23 27 37 48
Step by Step Solution
3.27 Rating (139 Votes )
There are 3 Steps involved in it

Get step-by-step solutions from verified subject matter experts