

Question: Using the graph below, explain why economic surplus would be smaller if Q1 or Q3 were the quantity produced than if Q2 is the quantity
Using the graph below, explain why economic surplus would be smaller if Q1 or Q3 were the quantity produced than if Q2 is the quantity produced.
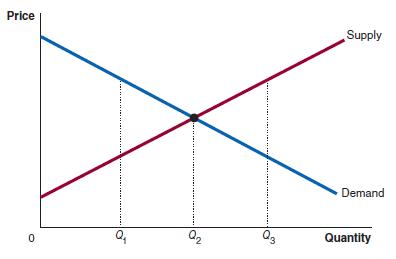
Price Supply Demand 0 Q2 Q3 Quantity
Step by Step Solution
There are 3 Steps involved in it
1 Expert Approved Answer
Step: 1 Unlock

Question Has Been Solved by an Expert!
Get step-by-step solutions from verified subject matter experts
Step: 2 Unlock
Step: 3 Unlock