

Question: Using the Harrison and Rubinfeld (1978) data published in Belsley, Kuh and Welsch (1980) and provided on the Springer website as Hedonic.xls, reproduce Table 9.1.
Using the Harrison and Rubinfeld (1978) data published in Belsley, Kuh and Welsch (1980) and provided on the Springer website as Hedonic.xls, reproduce Table 9.1. Perform the Hausman test based on the fixed effects and the random effects contrast. Perform the LM test for \(H_{0} ; \sigma_{\mu}^{2}=0\).
Table 9.1:
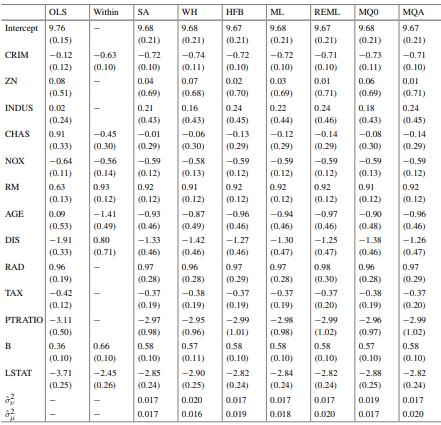
OLS Within SA WH HFB ML. REML MQ0 MQA Intercept 9.76 9.68 9.68 9.67 9.68 9.67 9.68 9.67 (0.15) (0.21) (0.21) (0.21) (0.21) (0.21) (0.21) (0.21) CRIM -0.12 -0.63 -0.72 -0.74 -0.72 -0.72 -0.71 -0.73 -0.71 (0.12) (0.10) (0.10) (0.11) (0.10) (0.10) (0.10) (0.11) (0.10) ZN 0.08 0.04 0.07 0.02 0.03 0.01 0.06 0.01 (0.51) (0.69) (0.68) (0.70) (0.69) (0.71) (0.69) (0.71) INDUS 0.02 0.21 0.16 0.24 0.22 0.24 0.18 0.24 (0.24) (0.43) (0.43) (0.45) (0.44) (0.46) (0.43) (0.45) CHAS 0.91 -0.45 -0.01 -0.06 -0.13 -0.12 -0.14 -0.08 -0.14 (0.33) (0.30) (0.29) (0.30) (0.29) (0.29) (0.29) (0.30) (0.29) NOX -0.64 -0.56 -0.59 -0.58 -0.59 -0.59 -0.59 -0.59 -0.59 (0.11) (0.14) (0.12) (0.13) (0.12) (0.12) (0.12) (0.13) (0.12) RM 0.63 0.93 0.92 0.91 0.92 0.92 0.92 0.91 0.92 (0.13) (0.12) (0.12) (0.12) (0.12) (0.12) (0.12) (0.12) (0.12) AGE 0.09 -1.41 -0.93 -0.87 -0.96 -0.94 -0.97 -0.90 -0.96 (0.53) (0.49) (0.46) (0.49) (0.46) (0.46) (0.46) (0.48) (0.46) DIS -1.91 0.80 -1.33 -1.42 -1.27 -1.30 -1.25 -1.38 -1.26 (0.33) (0.71) (0.46) (0.46) (0.46) (0.47) (0.47) (0.46) (0.47) RAD 0.96 0.97 0.96 0.97 0.97 0.98 0.96 0.97 (0.19) (0.28) (0.28) (0.29) (0.28) (0.30) (0.28) (0.29) TAX -0.42 -0.37 -0.38 -0.37 -0.37 -0.37 -0.38 -0.37 (0.12) (0.19) (0.19) (0.19) (0.19) (0.20) (0.19) (0.20) PTRATIO -3.11 -2.97 -2.95 -2.99 -2.98 -2.99 -2.96 -2.99 (0.50) (0.98) (0.96) (1.01) (0.98) (1.02) (0.97) (1.02) B 0.36 0.66 0.58 0.57 0.58 0.58 0.58 0.57 0.58 (0.10) (0.10) (0.10) (0.11) (0.10) (0.10) (0.10) (0.10) (0.10) LSTAT -3.71 -2.45 -2.85 -2.90 -2.82 -2.84 -2.82 -2.88 -2.82 (0.25) (0.26) (0.24) (0.25) (0.24) (0.24) (0.24) (0.25) (0.24) 0.017 0.020 0.017 0.017 0.017 0.019 0.017 T 0.017 0.016 0.019 0.018 0.020 0.017 0.020
Step by Step Solution
3.37 Rating (150 Votes )
There are 3 Steps involved in it

Get step-by-step solutions from verified subject matter experts