

Question: 11.2 a. Answer (a) through (c) from Exercise 11.1 using the results in column (2). b. Sketch the predicted probabilities from the probit and logit
11.2
a. Answer
(a) through
(c) from Exercise 11.1 using the results in column (2).
b. Sketch the predicted probabilities from the probit and logit in columns
(1) and (2) for values of Schooling between 0 and 18. Are the probit and logit models similar? 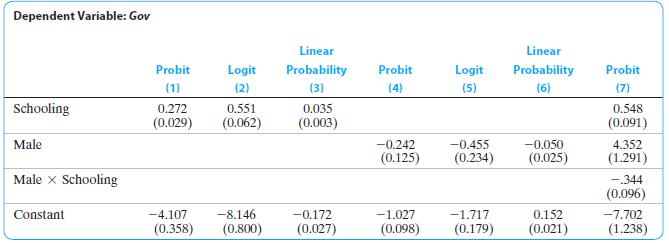
Dependent Variable: Gov Linear Linear Probit Logit Probability Probit Logit Probability Probit (1) (2) (3) (4) (5) (6) (7) Schooling 0.272 0.551 0.035 0.548 (0.029) (0.062) (0.003) (0.091) Male -0.242 -0.455 -0.050 (0.125) (0.234) (0.025) 4.352 (1.291) Male X Schooling Constant -.344 (0.096) -4.107 -8.146 -0.172 -1.027 -1.717 0.152 -7.702 (0.358) (0.800) (0.027) (0.098) (0.179) (0.021) (1.238)
Step by Step Solution
There are 3 Steps involved in it

Get step-by-step solutions from verified subject matter experts