

Question: 3.13 Data on fifth-grade test scores (reading and mathematics) for 400 school districts in California yield Y = 712.1 and standard deviation sY = 23.2.
3.13 Data on fifth-grade test scores (reading and mathematics) for 400 school districts in California yield Y = 712.1 and standard deviation sY = 23.2.
a. Construct a 90% confidence interval for the mean test score in the population.
b. When the districts were divided into districts with small classes (6 20 students per teacher) and large classes (≥ 20 students per teacher), the following results were found:
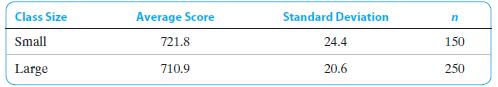
Is there statistically significant evidence that the districts with smaller classes have higher average test scores? Explain.
Class Size Average Score Standard Deviation n Small 721.8 24.4 150 Large 710.9 20.6 250
Step by Step Solution
There are 3 Steps involved in it

Get step-by-step solutions from verified subject matter experts