

Question: T. {S 62: W Chapter 3: 3. ll} Data on h grade test scores {reading and mathematics] for 421'] school districts in California yield average
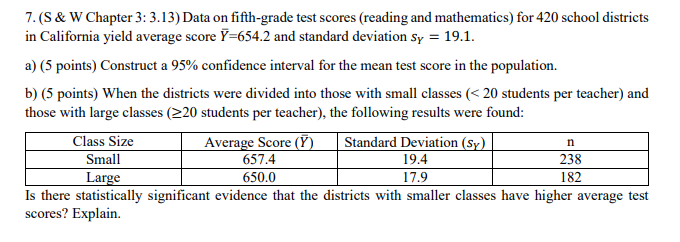
T. {S 62: W Chapter 3: 3. ll} Data on h grade test scores {reading and mathematics] for 421'] school districts in California yield average score l7=654.2 and standard deviation s? = 19.1. a} {5 points] Construct a 95% condence interval lot the mean test score in the population. h} [5 points} 1When the districts were divided into those with small classes ('1 21] students per teacher] and those with large classes {220' students per teacher]:1 the following resttlts were found: even-28cm Ft Standard Deviatiun s - am am Is there statistically signicant evidence that the districts with smaller classes have higher average test scores? Explain
Step by Step Solution
There are 3 Steps involved in it

Get step-by-step solutions from verified subject matter experts