

Question: (a) Plot the 2, 3, 4, 5, 6 and 9 months United States zero coupon yields using a line chart and compare the result in
(a) Plot the 2, 3, 4, 5, 6 and 9 months United States zero coupon yields using a line chart and compare the result in Figure 2.6.
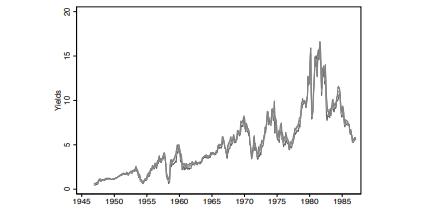
(b) Compute the spreads on the 3-month, 5-month and 9-month zero coupon yields relative to the 2-month yield and and plot these spreads using a line chart. Compare the graph with Figure 2.6.

(c) Compare the graphs in parts (a) and (b) and discuss the time series properties of yields and spreads.
8 20 CL Yields 10 50 1945 1950 1955 1960 1965 1970 1975 1980 1985
Step by Step Solution
★★★★★
3.39 Rating (152 Votes )
There are 3 Steps involved in it
1 Expert Approved Answer
Step: 1 Unlock

Question Has Been Solved by an Expert!
Get step-by-step solutions from verified subject matter experts
Step: 2 Unlock
Step: 3 Unlock