

Question: A researcher is interested in predicting average test scores for elementary schools in Arizona. She collects data on three variables from 200 randomly chosen Arizona
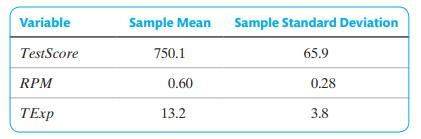
A researcher is interested in predicting average test scores for elementary schools in Arizona. She collects data on three variables from 200 randomly chosen Arizona elementary schools: average test scores (TestScore) on a standardized test, the fraction of students who qualify for reduced-priced meals (RPM), and the average years of teaching experience for the school's teachers (TExp). The table below shows the sample means and standard deviations from her sample.
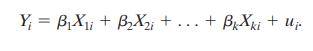
After standardizing RPM and TEXP and subtracting the sample mean from TestScore, she estimates the following regression:
\[ \widehat{\text { TestScore }}=-48.7 \times R P M+8.7 \times \text { TExp, SER }=44.0 \]
a. You are interested in using the estimated regression to predict average test scores for an out-of-sample school with \(R P M=0.52\) and \(T E X P=11.1\).
i. Compute the transformed (standardized) values of RPM and TEXP for this school; that is, compute the \(X^{\text {oos }}\) values from the \(X^{* 0 o s}\) values, as discussed preceding Equation (14.2).
ii. Compute the predicted value of average test scores for this school.
b. The actual average test score for the school is 775.3. Compute the error for your prediction.
c. The regression shown above was estimated using the standardized regressors and the demeaned value of TestScore. Suppose the regression had been estimated using the raw data for TestScore, RMP, and TExp. Calculate the values of the regression intercept and slope coefficients for this regression.
d. Use the regression coefficients that you computed in (c) to predict average test scores for an out-of-sample school with \(R P M=0.52\) and \(T E x p=11.1\). Verify that the prediction is identical to the prediction you computed in (a.ii).
Equation (14.2)
Variable Sample Mean Sample Standard Deviation TestScore 750.1 65.9 RPM 0.60 0.28 TExp 13.2 3.8
Step by Step Solution
3.53 Rating (167 Votes )
There are 3 Steps involved in it

Get step-by-step solutions from verified subject matter experts