

Question: For the data given in the following table, regress average compensation Y on average productivity X, treating employment size as the unit of observation. Interpret
a. From the preceding regression obtain the residuals ûi.
b. Following the Park test, regress ln û2i on ln Xi and verify the regression Eq. (11.5.4).
c. Following the Glejser approach, regress |uÌ‚i| on Xi and then regress |uÌ‚i| on ˆšXi and comment on your results.
d. Find the rank correlation between |ûi| and Xi and comment on the nature of heteroscedasticity, if any, present in the data.
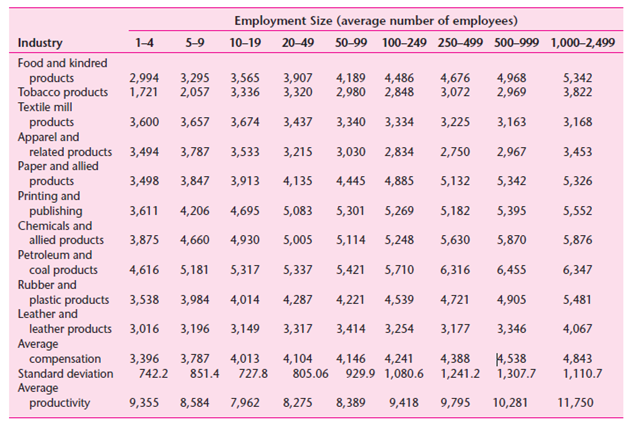
Employment Size (average number of employees) Industry 1-4 5-9 10-19 20-49 50-99 100-249 250499 500-999 1,0002,499 Food and kindred 5,342 3,822 products Tobacco products 2,994 1,721 3,295 2,057 3,565 3,336 3,907 3,320 4,189 2,980 4,486 2,848 4,676 3,072 4,968 2,969 Textile mill products Apparel and related products Paper and allied products Printing and publishing Chemicals and 3,600 3,657 3,674 3,437 3,340 3,334 3,225 3,163 3,168 3,787 3,494 3,533 3,215 3,030 2,834 2,750 2,967 3,453 3,498 3,847 3,913 4,135 4,445 4,885 5,132 5,342 5,326 3,611 4,695 4,206 5,083 5,301 5,269 5,182 5,395 5,552 allied products Petroleum and 3,875 4,930 5,248 4,660 5,005 5,114 5,630 5,870 5,876 6,347 coal products Rubber and 4,616 5,181 5,317 5,337 5,421 5,710 6,316 6,455 3,984 4,905 plastic products Leather and 3,538 4,014 4,287 4,221 4,539 4,721 5,481 3,149 leather products Average compensation Standard deviation 3,016 3,196 3,317 3,414 3,254 3,177 3,346 4,067 4,388 929.9 1,080.6 1,241.2 1,307.7 3,787 4,013 4,538 3,396 4,104 4,146 4,241 4,843 1,110.7 742.2 851.4 727.8 805.06 Average productivity 9,418 9,355 8,584 7,962 8,275 8,389 9,795 10,281 11,750
Step by Step Solution
3.48 Rating (164 Votes )
There are 3 Steps involved in it
The regression results are already given in 1153 If average productivity increases by a dollar on av... View full answer

Get step-by-step solutions from verified subject matter experts
Document Format (2 attachments)
1529_605d88e1d54d9_656825.pdf
180 KBs PDF File
1529_605d88e1d54d9_656825.docx
120 KBs Word File