

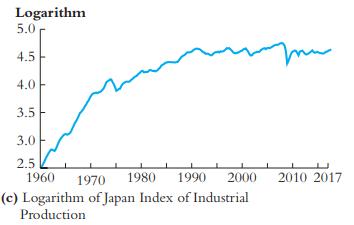
Look at the plot of the logarithm of the Japan Index of Industrial Production in Figure 15.2c.
Question:
Look at the plot of the logarithm of the Japan Index of Industrial Production in Figure 15.2c. Does this time series appear to be stationary? Explain. Suppose you calculated the first difference of this series. Would it appear to be stationary? Explain.
Figure 15.2c
Step by Step Answer:

This question has not been answered yet.
You can Ask your question!
Related Book For 
Question Posted:
