

Question: Refer to Example 8.3. Use the t test as shown in Eq. (8.6.4) to find out if there were constant returns to scale in the
In Example 8.3
By way of illustrating the preceding discussion, consider the data given in the following table. Attempting to fit the Cobb€“Douglas production function to these data yielded the following results:
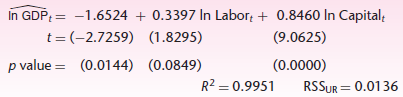
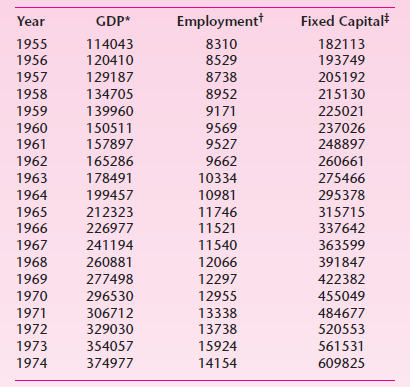
In GDP: = -1.6524 + 0.3397 In Labor; + 0.8460 In Capital, t = (-2.7259) (1.8295) (9.0625) (0.0000) RSSUR = 0.0136 p value = (0.0144) (0.0849) R = 0.9951 Year GDP* Employmentt Fixed Capital 1955 114043 8310 182113 1956 120410 8529 193749 1957 129187 8738 205192 1958 134705 8952 215130 1959 139960 9171 225021 1960 150511 9569 237026 1961 157897 9527 248897 1962 165286 9662 260661 1963 178491 10334 275466 1964 199457 10981 295378 1965 212323 11746 315715 1966 226977 11521 337642 1967 241194 11540 363599 1968 260881 12066 391847 1969 277498 12297 422382 1970 296530 12955 455049 1971 306712 13338 484677 1972 329030 13738 520553 1973 354057 15924 561531 1974 374977 14154 609825
Step by Step Solution
3.43 Rating (169 Votes )
There are 3 Steps involved in it
To use the t test given in 874 we need to know the covariance between the two slope es... View full answer

Get step-by-step solutions from verified subject matter experts
Document Format (2 attachments)
1529_605d88e1d06c2_656457.pdf
180 KBs PDF File
1529_605d88e1d06c2_656457.docx
120 KBs Word File