

Question: Refer to Problem 3.22. In exercise Table 3.7 gives data on gold prices, the Consumer Price Index (CPI), and the New York Stock Exchange (NYSE)
Refer to Problem 3.22.
In exercise
Table 3.7 gives data on gold prices, the Consumer Price Index (CPI), and the New York Stock Exchange (NYSE) Index for the United States for the period 1974 €“2006. The NYSE Index includes most of the stocks listed on the NYSE, some 1500-plus.
Table 3.7
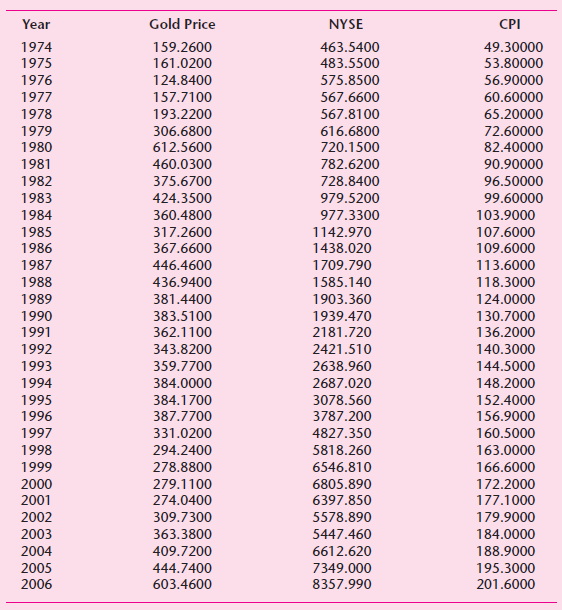
a. Estimate the two regressions given there, obtaining standard errors and the other usual output.
b. Test the hypothesis that the disturbances in the two regression models are normally distributed.
c. In the gold price regression, test the hypothesis that β2 = 1, that is, there is a one to one relationship between gold prices and CPI (i.e., gold is a perfect hedge). What is the p value of the estimated test statistic?
d. Repeat step (c) for the NYSE Index regression. Is investment in the stock market a perfect hedge against inflation? What is the null hypothesis you are testing? What is its p value?
e. Between gold and stock, which investment would you choose? What is the basis of your decision?
Gold Price Year NYSE CPI 1974 159.2600 463.5400 49.30000 1975 161.0200 483.5500 53.80000 1976 124.8400 575.8500 56.90000 60.60000 1977 157.7100 567.6600 1978 193.2200 567.8100 65.20000 1979 1980 1981 306.6800 616.6800 72.60000 612.5600 720.1500 82.40000 460.0300 782.6200 90.90000 375.6700 728.8400 96.50000 1982 1983 424.3500 979.5200 99.60000 1984 360.4800 977.3300 103.9000 317.2600 107.6000 109.6000 1985 1142.970 1986 367.6600 1438.020 1987 446.4600 1709.790 113.6000 1988 436.9400 1585.140 118.3000 124.0000 1989 381.4400 1903.360 1990 383.5100 1939.470 130.7000 136.2000 1991 362.1100 2181.720 1992 343.8200 2421.510 140.3000 1993 359.7700 2638.960 144.5000 384.0000 2687.020 148.2000 1994 1995 384.1700 152.4000 3078.560 1996 387.7700 3787.200 156.9000 160.5000 1997 331.0200 4827.350 294.2400 1998 5818.260 163.0000 1999 278.8800 6546.810 166.6000 6805.890 2000 279.1100 172.2000 2001 274.0400 6397.850 177.1000 309.7300 179.9000 2002 5578.890 2003 363.3800 5447.460 184.0000 2004 409.7200 6612.620 188.9000 2005 444.7400 7349.000 195.3000 2006 603.4600 8357.990 201.6000
Step by Step Solution
3.29 Rating (173 Votes )
There are 3 Steps involved in it
a The two regressions are as follows Goldpricet 2152856 10384 CPI t se 544685 04038 t 39525 25718 r ... View full answer

Get step-by-step solutions from verified subject matter experts
Document Format (2 attachments)
1529_605d88e1cce10_656204.pdf
180 KBs PDF File
1529_605d88e1cce10_656204.docx
120 KBs Word File