

Question: Refer to the airline example discussed in the text. Instead of the linear model given in Eq. (16.4.2), estimate a loglinear regression model and compare
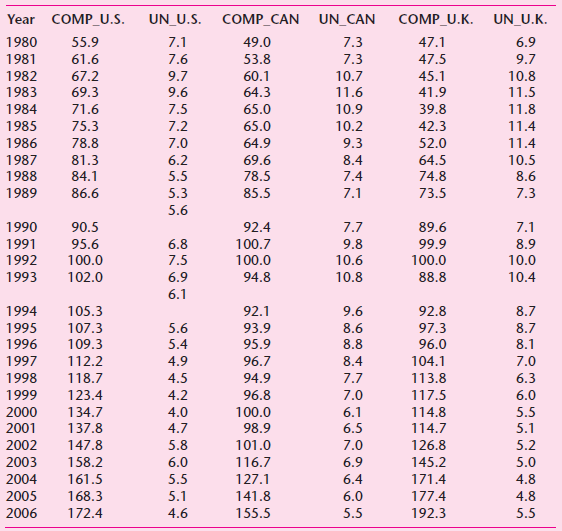
Year COMP_U.S. UN_U.S. COMP_CAN UN_CAN COMP_U.K. UN_U.K. 1980 55.9 7.1 49.0 7.3 47.1 6.9 1981 61.6 7.6 53.8 7.3 47.5 9.7 9.7 9.6 10.8 11.5 11.8 1982 45.1 67.2 60.1 10.7 1983 69.3 64.3 11.6 41.9 65.0 1984 71.6 7.5 10.9 39.8 1985 75.3 7.2 65.0 10.2 42.3 11.4 64.9 1986 78.8 7.0 9.3 52.0 11.4 1987 81.3 6.2 69.6 8.4 64.5 10.5 1988 84.1 5.5 78.5 7.4 74.8 8.6 73.5 1989 86.6 5.3 85.5 7.1 7.3 5.6 90.5 89.6 1990 92.4 7.7 7.1 95.6 1991 6.8 100.7 9.8 99.9 8.9 1992 100.0 7.5 100.0 10.6 100.0 10.0 1993 102.0 6.9 94.8 10.8 88.8 10.4 6.1 92.8 97.3 96.0 1994 105.3 92.1 9.6 8.7 107.3 1995 5.6 93.9 8.6 8.7 1996 109.3 5.4 95.9 8.8 8.1 1997 112.2 4.9 96.7 8.4 104.1 7.0 4.5 7.7 1998 118.7 94.9 113.8 6.3 123.4 1999 2000 4.2 96.8 7.0 117.5 6.0 134.7 4.0 100.0 6.1 114.8 5.5 114.7 126.8 2001 137.8 4.7 98.9 6.5 5.1 2002 147.8 5.8 101.0 7.0 5.2 2003 158.2 6.0 116.7 6.9 145.2 5.0 2004 161.5 5.5 127.1 6.4 171.4 4.8 5.1 141.8 2005 168.3 6.0 177.4 4.8 172.4 2006 4.6 155.5 5.5 192.3 5.5
Step by Step Solution
3.50 Rating (157 Votes )
There are 3 Steps involved in it
Results for the loglinear model are as follows Dependent Variable LNC Method Least Squares Sample ... View full answer

Get step-by-step solutions from verified subject matter experts
Document Format (2 attachments)
1529_605d88e1da30a_666458.pdf
180 KBs PDF File
1529_605d88e1da30a_666458.docx
120 KBs Word File