

Question: Refer to the data in the following table. a. Let Y = eggs produced (in millions) and X = price of eggs (cents per dozen).
Refer to the data in the following table.
a. Let Y = eggs produced (in millions) and X = price of eggs (cents per dozen). Estimate the model for the years 1990 and 1991 separately.
b. Pool the observations for the two years and estimate the pooled regression. What assumptions are you making in pooling the data?
c. Use the fixed effects model, distinguishing the two years, and present the regression results.
d. Can you use the fixed effects model, distinguishing the 50 states? Why or why not?
e. Would it make sense to distinguish both the state effect and the year effect? If so, how many dummy variables would you have to introduce?
f. Would the error components model be appropriate to model the production of eggs? Why or why not? See if you can estimate such a model using, say, EViews.
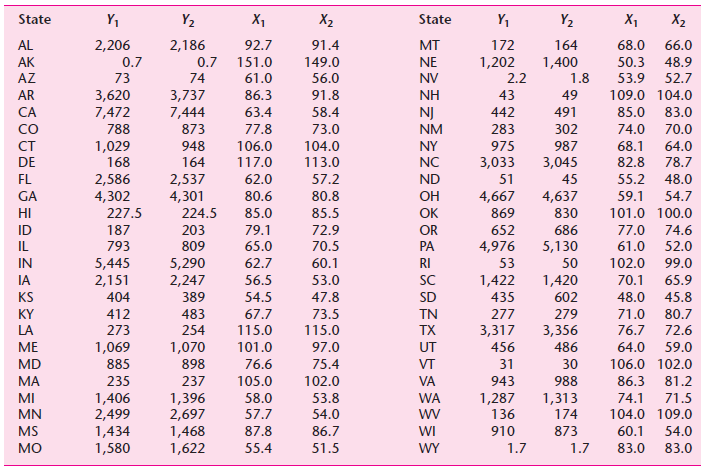
State Y1 Y2 X1 X2 State Y, Y2 X1 X2 92.7 66.0 AL 2,206 2,186 91.4 T 172 164 68.0 149.0 1,202 1,400 AK 0.7 0.7 151.0 NE 50.3 48.9 AZ 73 74 61.0 56.0 NV 2.2 1.8 53.9 52.7 3,737 7,444 AR 3,620 7,472 86.3 91.8 NH 43 49 109.0 104.0 63.4 442 491 83.0 CA 58.4 NJ 85.0 Co 77.8 74.0 70.0 788 873 73.0 NM 283 302 64.0 CT 1,029 168 948 106.0 104.0 NY 975 987 68.1 DE 164 117.0 113.0 NC 3,033 3,045 82.8 78.7 FL 2,586 4,302 227.5 2,537 4,301 62.0 57.2 ND 51 45 55.2 48.0 GA 80.6 80.8 4,667 4,637 59.1 54.7 85.5 224.5 85.0 869 830 101.0 100.0 203 809 5,290 2,247 187 79.1 72.9 OR 652 686 77.0 74.6 793 IL 65.0 70.5 PA 4,976 5,130 61.0 52.0 60.1 53.0 IN 5,445 2,151 62.7 RI 53 50 102.0 99.0 SC 70.1 IA 56.5 1,422 435 1,420 65.9 KS 404 389 54.5 47.8 SD 602 48.0 45.8 KY 412 483 67.7 73.5 277 279 71.0 80.7 273 115.0 LA 254 115.0 3,317 3,356 76.7 72.6 101.0 97.0 ME 1,069 1,070 898 456 486 64.0 59.0 MD 885 76.6 75.4 31 30 106.0 102.0 943 81.2 235 237 105.0 102.0 VA 988 86.3 1,396 2,697 1,468 1,622 1,287 MI 1,406 2,499 1,434 1,580 58.0 53.8 WA 1,313 174 74.1 71.5 54.0 MN 57.7 wv 136 104.0 109.0 87.8 86.7 60.1 54.0 MS WI 910 873 MO 55.4 51.5 WY 1.7 1.7 83.0 83.0
Step by Step Solution
3.35 Rating (176 Votes )
There are 3 Steps involved in it
a Year Intercept slope R 2 d 1990 3118484 224984 00834 198 35718 20894 1991 3149356 233485 00972 19 ... View full answer

Get step-by-step solutions from verified subject matter experts
Document Format (2 attachments)
1529_605d88e1da58a_666459.pdf
180 KBs PDF File
1529_605d88e1da58a_666459.docx
120 KBs Word File