

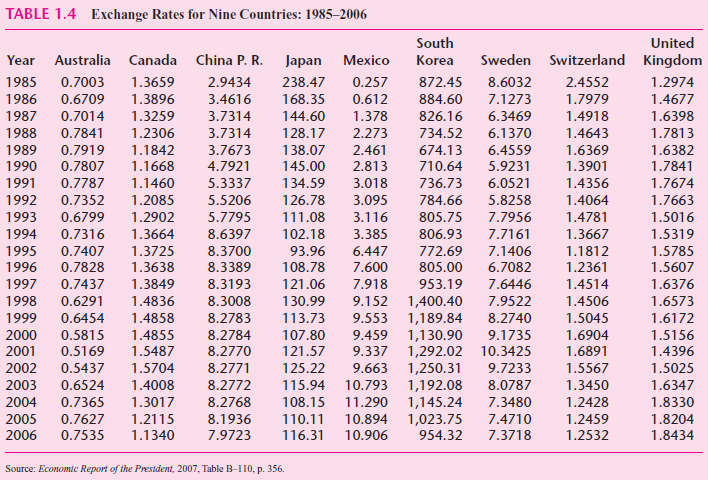
Table 1.4 gives the foreign exchange rates for nine industrialized countries for the years 19852006. Except for
Question:
a. Plot these exchange rates against time and comment on the general behavior of the exchange rates over the given time period.
b. The dollar is said to appreciate if it can buy more units of a foreign currency. Contrarily, it is said to depreciate if it buys fewer units of a foreign currency. Over the time period 1985€“2006, what has been the general behavior of the U.S. dollar? Incidentally, look up any textbook on macroeconomics or international economics to find out what factors determine the appreciation or depreciation of a currency.
Fantastic news! We've Found the answer you've been seeking!
Step by Step Answer:
a For better visual impression the logarithm of the ...View the full answer

Answered By
Cyrus Sandoval
I a web and systems developer with a vast array of knowledge in many different front end and back end languages, responsive frameworks, databases, and best code practices. My objective is simply to be the best web developer that i can be and to contribute to the technology industry all that i know and i can do. My skills include:
- Front end languages: css, HTML, Javascript, XML
- Frameworks: Angular, Jquery, Bootstrap, Jasmine, Mocha
- Back End Languages: Java, Javascript, PHP,kotlin
- Databases: MySQL, PostegreSQL, Mongo, Cassandra
- Tools: Atom, Aptana, Eclipse, Android Studio, Notepad++, Netbeans.
Having a degree in Computer Science enabled me to deeply learn most of the things regarding programming, and i believe that my understanding of problem solving and complex algorithms are also skills that have and will continue to contribute to my overall success as a developer.
I’ve worked on countless freelance projects and have been involved with a handful of notable startups. Also while freelancing I was involved in doing other IT tasks requiring the use of computers from working with data, content creation and transcription.
1+ Reviews
10+ Question Solved
Related Book For 

Question Posted:
