Business
Econometrics
The data behind the M1 money supply in Figure 1.5
The data behind the M1 money supply in Figure 1.5 are given in Table 1.5. Can you
Question:
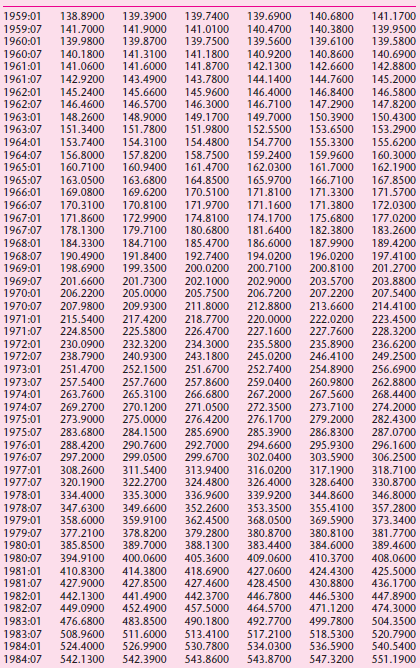
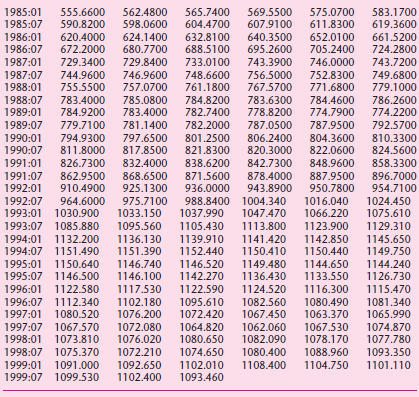
The data behind the M1 money supply in Figure 1.5 are given in Table 1.5. Can you give reasons why the money supply has been increasing over the time period shown in the table?
Table 1.5 Seasonally adjusted M1 Supply: 1959:01-1999:07 (billions of dollars)
Transcribed Image Text:
138.8900 139.3900 1959:01 139.7400 139.6900 140.6800 141.1700 1959:07 139.9500 141.7000 139.9800 141.9000 139.8700 141.0100 139.7500 141.1800 140.4700 139.5600 140.3800 139.6100 140.8600 1960:01 139.5800 1960:07 140.1800 141.0600 141.3100 141.6000 140.9200 142.1300 140.6900 142.8800 1961:01 141.8700 142.6600 1961:07 142.9200 143.4900 143.7800 144.1400 144.7600 145.2000 145.6600 146.5700 148.9000 151.7800 1962:01 1962:07 145.2400 146.4600 145.9600 146.3000 146.4000 146.7100 146.8400 147.2900 146.5800 147.8200 1963:01 1963:07 148.2600 151.3400 149.1700 151.9800 149.7000 152.5500 150.3900 153.6500 150.4300 153.2900 155.6200 154.4800 1964:01 153.7400 154.3100 154.7700 155.3300 1964:07 156.8000 160.7100 157.8200 160.9400 158.7500 159.2400 159.9600 161.7000 160.3000 162.1900 161.4700 162.0300 1965:01 1965:07 1966:01 163.0500 169.0800 163.6800 169.6200 164.8500 170.5100 165.9700 171.8100 166.7100 171.3300 167.8500 171.5700 1966:07 170.3100 170.8100 171.9700 171.1600 171.3800 172.0300 1967:01 1967:07 174.1700 181.6400 171.8600 178.1300 172.9900 179.7100 174.8100 180.6800 175.6800 182.3800 177.0200 183.2600 1968:01 1968:07 1969:01 184.3300 184.7100 185.4700 186.6000 187.9900 189.4200 190.4900 198.6900 191.8400 199.3500 192.7400 194.0200 200.7100 196.0200 200.8100 197.4100 201.2700 200.0200 202.9000 206.7200 1969:07 1970:01 201.6600 206.2200 201.7300 205.0000 202.1000 205.7500 203.5700 207.2200 203.8800 207.5400 1970:07 207.9800 209.9300 211.8000 212.8800 213.6600 214.4100 1971:01 1971:07 215.5400 224.8500 217.4200 225.5800 232.3200 218.7700 226.4700 220.0000 227.1600 222.0200 227.7600 223.4500 228.3200 1972:01 230.0900 238.7900 234.3000 243.1800 235.5800 245.0200 235.8900 246.4100 236.6200 249.2500 1972:07 240.9300 1973:01 251.4700 252.1500 251.6700 252.7400 254.8900 256.6900 1973:07 1974:01 257.5400 263.7600 257.7600 265.3100 257.8600 266.6800 259.0400 267.2000 272.3500 260.9800 267.5600 262.8800 268.4400 1974:07 1975:01 269.2700 273.9000 270.1200 275.0000 284.1500 290.7600 271.0500 276.4200 273.7100 279.2000 274.2000 282.4300 276.1700 1975:07 283.6800 285.6900 285.3900 286.8300 287.0700 296.1600 306.2500 288.4200 1976:01 1976:07 292.7000 299.6700 294.6600 302.0400 295.9300 303.5900 297.2000 299.0500 1977:01 1977:07 308.2600 320.1900 311.5400 322.2700 313.9400 324.4800 316.0200 326.4000 317.1900 328.6400 318.7100 330.8700 339.9200 1978:01 334.4000 335.3000 336.9600 344.8600 346.8000 1978:07 1979:01 347.6300 358.6000 349.6600 359.9100 352.2600 362.4500 353.3500 368.0500 355.4100 369.5900 357.2800 373.3400 1979:07 1980:01 377.2100 385.8500 378.8200 389.7000 400.0600 379.2800 388.1300 380.8700 383.4400 380.8100 384.6000 381.7700 389.4600 1980:07 394.9100 405.3600 409.0600 410.3700 408.0600 1981:01 410.8300 427.9000 414.3800 427.8500 418.6900 427.4600 427.0600 428.4500 424.4300 430.8800 425.5000 1981:07 436.1700 1982:01 1982:07 1983:01 442.1300 449.0900 441.4900 452.4900 483.8500 442.3700 457.5000 490.1800 446.7800 464.5700 446.5300 471.1200 447.8900 474.3000 476.6800 492.7700 499.7800 504.3500 517.2100 1983:07 1984:01 508.9600 524.4000 511.6000 513.4100 530.7800 518.5300 536.5900 520.7900 540.5400 526.9900 534.0300 1984:07 542.1300 542.3900 543.8600 543.8700 547.3200 551.1900 1985:01 1985:07 555.6600 590.8200 562.4800 598.0600 565.7400 604.4700 569.5500 607.9100 611.8300 575.0700 583.1700 619.3600 1986:01 1986:07 620.4000 672.2000 624.1400 632.8100 640.3500 695.2600 652.0100 705.2400 661.5200 680.7700 688.5100 724.2800 1987:01 729.3400 729.8400 733.0100 743.3900 746.0000 743.7200 1987:07 1988:01 744.9600 755.5500 746.9600 748.6600 756.5000 767.5700 752.8300 771.6800 749.6800 779.1000 757.0700 761.1800 1988:07 1989:01 1989:07 1990:01 1990:07 1991:01 783.4000 784.9200 785.0800 783.4000 784.8200 782.7400 782.2000 783.6300 778.8200 784.4600 774.7900 786.2600 774.2200 779.7100 781.1400 787.0500 787.9500 792.5700 794.9300 797.6500 817.8500 801.2500 821.8300 806.2400 804.3600 822.0600 810.3300 824.5600 811.8000 820.3000 826.7300 832.4000 838.6200 842.7300 848.9600 858.3300 1991:07 1992:01 862.9500 910.4900 868.6500 925.1300 975.7100 871.5600 936.0000 878.4000 943.8900 887.9500 950.7800 896.7000 954.7100 1992:07 1993:01 1030.900 964.6000 988.8400 1004.340 1037.990 1105.430 1016.040 1066.220 1024.450 1075.610 1033.150 1047.470 1993:07 1085.880 1095.560 1113.800 1123.900 1129.310 1994:01 1132.200 1994:07 1151.490 1136.130 1151.390 1139.910 1152.440 1141.420 1150.410 1142.850 1150.440 1145.650 1149.750 1995:01 1150.640 1995:07 1146.500 1146.740 1146.100 1146.520 1142.270 1149.480 1136.430 1144.650 1133.550 1144.240 1126.730 1996:01 1122.580 1117.530 1122.590 1124.520 1116.300 1115.470 1996:07 1112.340 1997:01 1080.520 1102.180 1076.200 1095.610 1072.420 1082.560 1067.450 1080.490 1063.370 1081.340 1065.990 1997:07 1067.570 1998:01 1073.810 1072.080 1076.020 1064.820 1080.650 1062.060 1082.090 1067.530 1078.170 1088.960 1074.870 1077.780 1998:07 1075.370 1072.210 1074.650 1080.400 1093.350 1108.400 1999:01 1091.000 1999:07 1099.530 1092.650 1102.400 1102.010 1093.460 1104.750 1101.110
View Answer
Fantastic news! We've Found the answer you've been seeking!
Question Posted:
Apr 30, 2018 02:44 AM