

Question: The data in the following table gives U.S. population, in millions of persons, for the period 19702007. Fit the growth models given in Exercise 14.7
The data in the following table gives U.S. population, in millions of persons, for the period 1970€“2007. Fit the growth models given in Exercise 14.7 and decide which model gives a better fit. Interpret the parameters of the model.
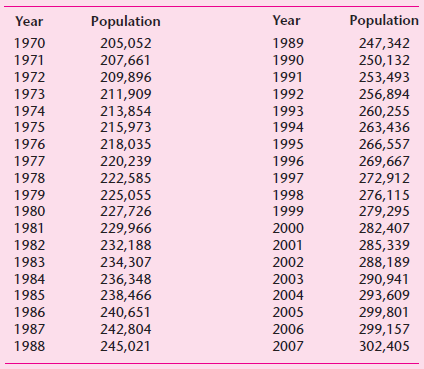
Population Year Population Year 205,052 207,661 209,896 211,909 213,854 215,973 218,035 220,239 222,585 225,055 227,726 229,966 232,188 234,307 236,348 238,466 240,651 242,804 245,021 1970 247,342 250,132 253,493 256,894 260,255 263,436 266,557 269,667 272,912 276,115 279,295 282,407 285,339 288,189 290,941 293,609 299,801 299,157 302,405 1989 1971 1990 1972 1991 1973 1992 1974 1993 1975 1994 1995 1976 1977 1996 1997 1978 1979 1998 1999 1980 1981 2000 1982 2001 1983 2002 2003 1984 1985 2004 1986 2005 1987 2006 1988 2007
Step by Step Solution
3.42 Rating (171 Votes )
There are 3 Steps involved in it
In the following models Y population and t time Yt 50... View full answer

Get step-by-step solutions from verified subject matter experts
Document Format (2 attachments)
1529_605d88e1d7153_666415.pdf
180 KBs PDF File
1529_605d88e1d7153_666415.docx
120 KBs Word File