

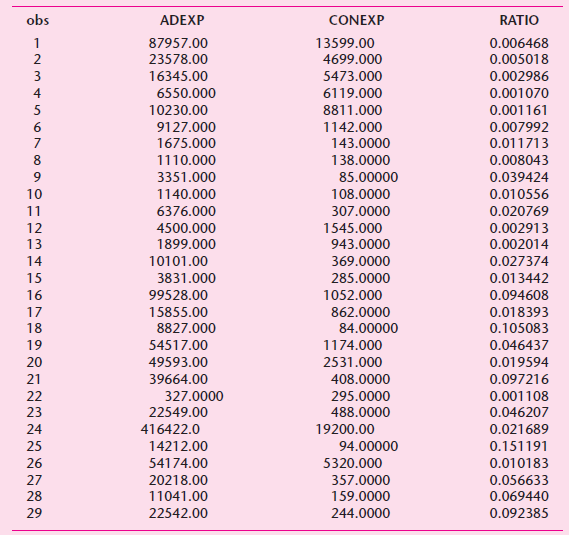
Question: The following table gives data for the U.K. on total consumer expenditure (in £ millions) and advertising expenditure (in £ millions) for 29 product categories.
The following table gives data for the U.K. on total consumer expenditure (in £ millions) and advertising expenditure (in £ millions) for 29 product categories.
a. Considering the various functional forms we have discussed in the chapter, which functional form might fit the data given in above table?
b. Estimate the parameters of the chosen regression model and interpret your results.
c. If you take the ratio of advertising expenditure to total consumer expenditure, what do you observe? Are there any product categories for which this ratio seems unusually high? Is there anything special about these product categories that might explain the relatively high expenditure on advertising?
obs ADEXP CONEXP RATIO 87957.00 13599.00 0.006468 2 23578.00 4699.000 0.005018 3 16345.00 5473.000 0.002986 4 6550.000 6119.000 0.001070 5 10230.00 8811.000 0.001161 9127.000 1142.000 0.007992 1675.000 143.0000 0.011713 1110.000 138.0000 0.008043 3351.000 85.00000 0.039424 1140.000 10 108.0000 0.010556 11 6376.000 307.0000 0.020769 12 13 4500.000 1545.000 0.002913 1899.000 943.0000 0.002014 14 10101.00 369.0000 0.027374 15 3831.000 285.0000 0.013442 16 99528.00 1052.000 0.094608 862.0000 84.00000 17 15855.00 8827.000 0.018393 18 0.105083 19 54517.00 1174.000 0.046437 20 49593.00 2531.000 0.019594 39664.00 408.0000 21 0.097216 22 327.0000 295.0000 0.001108 23 22549.00 488.0000 0.046207 416422.0 0.021689 24 19200.00 94.00000 5320.000 14212.00 25 0.151191 26 54174.00 0.010183 27 20218.00 357.0000 0.056633 28 11041.00 159.0000 0.069440 22542.00 29 244.0000 0.092385
Step by Step Solution
3.39 Rating (161 Votes )
There are 3 Steps involved in it
a The scattergram of total consumer expenditure and advertising expenditure is as follows b Although ... View full answer

Get step-by-step solutions from verified subject matter experts
Document Format (2 attachments)
1529_605d88e1cd61d_656220.pdf
180 KBs PDF File
1529_605d88e1cd61d_656220.docx
120 KBs Word File