

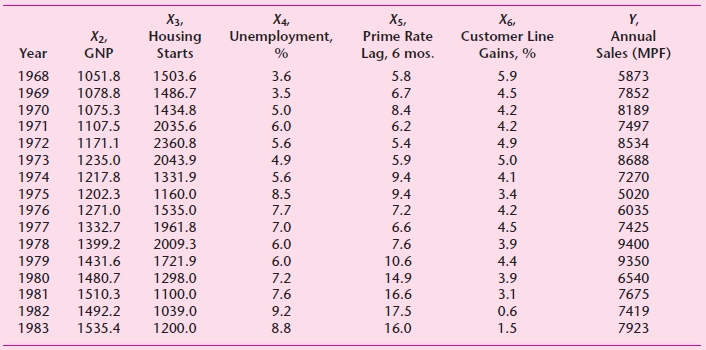
Question: The demand for cable. The following table gives data used by a telephone cable manufacturer to predict sales to a major customer for the period
The variables in the table are defined as follows:
Y = annual sales in MPF, million paired feet
X2 = gross national product (GNP), $, billions
X3 = housing starts, thousands of units
X4 = unemployment rate, %
X5 = prime rate lagged 6 months
X6 = Customer line gains, %
You are to consider the following model:
Yi = β1 + β2X2t + β3X3t + β4X4t + β5X5t + β6X6t + ut
a. Estimate the preceding regression.
b. What are the expected signs of the coefficients of this model?
c. Are the empirical results in accordance with prior expectations?
d. Are the estimated partial regression coefficients individually statistically significant at the 5 percent level of significance?
e. Suppose you first regress Y on X2, X3, and X4 only and then decide to add the variables X5 and X6. How would you find out if it is worth adding the variables X5 and X6? Which test do you use? Show the necessary calculations.
X4, , Housing Xs, Y, Annual X2, GNP Unemployment, Prime Rate Customer Line Sales (MPF) Year Starts Lag, 6 mos. Gains, % 1503.6 5.9 1968 1051.8 3.6 5.8 6.7 5873 4.5 1969 1078.8 1486.7 3.5 7852 1434.8 1970 1075.3 5.0 8.4 4.2 8189 1107.5 1971 2035.6 6.0 6.2 4.2 7497 2360.8 1972 1171.1 5.6 5.4 4.9 8534 5.0 1973 1235.0 2043.9 4.9 5.9 8688 1217.8 1331.9 1974 5.6 9.4 4.1 7270 5020 6035 1975 1202.3 1160.0 8.5 9.4 3.4 1271.0 1976 1535.0 7.7 7.2 4.2 1332.7 1977 1961.8 7.0 6.6 4.5 7425 2009.3 1978 1399.2 6.0 7.6 3.9 9400 1721.9 1979 1431.6 6.0 10.6 4.4 9350 1980 7.2 3.9 3.1 6540 1480.7 1298.0 14.9 1981 1510.3 1100.0 7.6 16.6 7675 1982 1039.0 1492.2 9.2 17.5 0.6 7419 1983 1535.4 1200.0 8.8 16.0 1.5 7923
Step by Step Solution
3.47 Rating (170 Votes )
There are 3 Steps involved in it
a The EViews3 output is as follows b One would expect 2 3 and 6 to be positive and ... View full answer

Get step-by-step solutions from verified subject matter experts
Document Format (2 attachments)
1529_605d88e1d01c7_656445.pdf
180 KBs PDF File
1529_605d88e1d01c7_656445.docx
120 KBs Word File