

The following table gives data on new passenger cars sold in the United States as a function
Question:
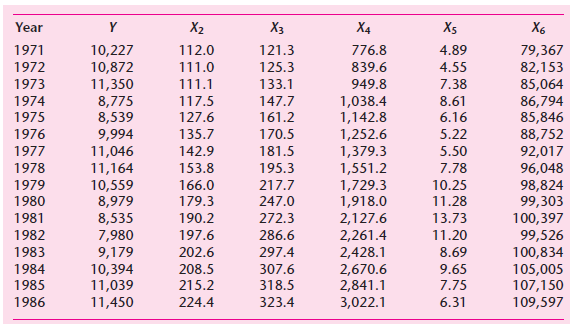
a. Develop a suitable linear or log€“linear model to estimate a demand function for automobiles in the United States.
b. If you decide to include all the regressors given in the table as explanatory variables, do you expect to face the multicollinearity problem? Why?
c. If you do expect to face the multicollinearity problem, how will you go about resolving the problem? State your assumptions clearly and show all the calculations explicitly.
Fantastic news! We've Found the answer you've been seeking!
Step by Step Answer:
a and c Examining the correlation coefficients between the possible explanatory variable...View the full answer

Answered By
Fahmin Arakkal
Tutoring and Contributing expert question and answers to teachers and students.
Primarily oversees the Heat and Mass Transfer contents presented on websites and blogs.
Responsible for Creating, Editing, Updating all contents related Chemical Engineering in
latex language
8+ Reviews
22+ Question Solved
Related Book For 

Question Posted:
