

Question: Use the data described in Table 3.6 to answer the following questions about the relationship between hours worked and tax rates: (a) For each data
Use the data described in Table 3.6 to answer the following questions about the relationship between hours worked and tax rates:
(a) For each data set (for women and for men), create a scatterplot of hours worked on the \(\mathrm{Y}\)-axis and tax rates on the \(\mathrm{X}\)-axis.
(b) For each data, set estimate an OLS regression in which hours worked is regressed on tax rates. Report the estimated regression equation, and interpret the coefficients. Explain any differences in coefficients.
(c) What are the fitted value and residual for men in the United States?
(d) What are the fitted value and residual for women in Italy?
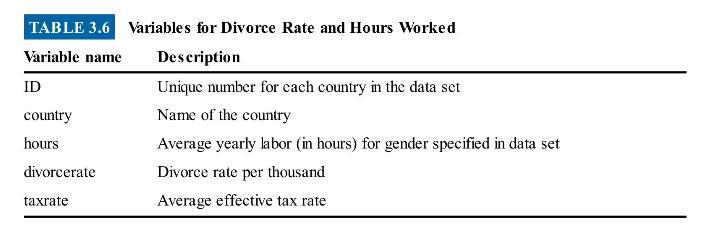
TABLE 3.6 Variables for Divorce Rate and Hours Worked Variable name Description Unique number for each country in the data set Name of the country ID country hours divorcerate Divorce rate per thousand taxrate Average effective tax rate Average yearly labor (in hours) for gender specified in data set
Step by Step Solution
3.36 Rating (152 Votes )
There are 3 Steps involved in it

Get step-by-step solutions from verified subject matter experts