

Question: Using the data given in the following, test the hypothesis that the error variances in the two subperiods 1958IV to 1966III and 1966IV to 1971II
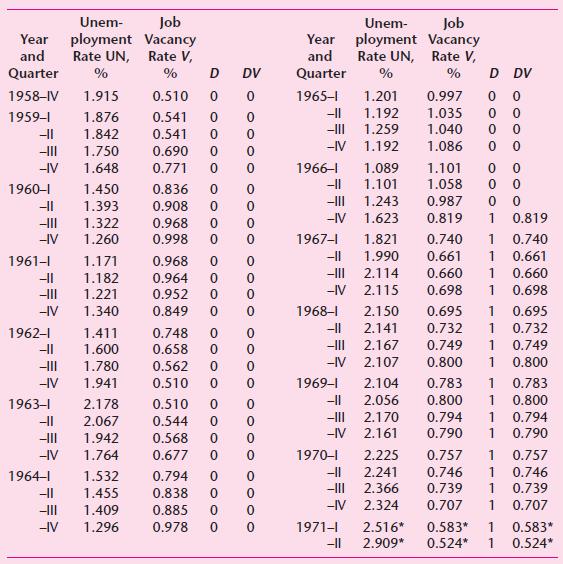
Job ployment Vacancy Rate UN, Rate V, Unem- Job ployment Vacancy Rate UN, Rate V, Unem- Year Year and and Quarter D DV Quarter DV % 1965 1958IV 0.997 1.915 0.510 1.201 -I| 1.192 1.035 1959I 1.876 0.541 1.040 -II 1.259 1.842 0.541 -IV 1.192 1.086 -HII 1.750 0.690 -IV 1.648 0.771 1966I 1.089 1.101 1.058 -|| 1.101 0.836 1960I 1.450 -II 1.243 0.987 1.393 0.908 -IV 1.623 0.819 0.819 -II 1.322 1.260 0.968 -IV 0.998 1967- 1.821 0.740 0.740 -II 1.990 0.661 0.661 1961- 1.171 0.968 -II 2.114 0.660 0.660 0.698 0.964 1.182 -IV 2.115 0.698 -II 1.221 0.952 1.340 -IV 0.849 1968 2.150 0.695 0.695 -|| 2.141 0.732 0.732 1962I 1.411 0.748 -II 2.167 0.749 0.749 1.600 0.658 -IV 2.107 0.800 0.800 -II 1.780 0.562 1969I -IV 1.941 0.510 2.104 0.783 0.783 -|| 2.056 0.800 0.800 1963I 2.178 0.510 -II 2.170 0.794 0.794 2.067 0.544 -IV 2.161 0.790 0.790 1.942 0.568 1970 -IV 1.764 0.677 2.225 0.757 0.757 0.746 -I| 2.241 0.746 1964I 1.532 0.794 -II 2.366 0.739 0.739 1.455 0.838 0.707 -IV 2.324 0.707 1 1.409 0.885 1971- 2.516* 0.583* -IV 1.296 0.978 0.583* 1 0.524* -|I 2.909* 0.524*
Step by Step Solution
3.32 Rating (158 Votes )
There are 3 Steps involved in it
Running the regression for the two periods separately we fi... View full answer

Get step-by-step solutions from verified subject matter experts
Document Format (2 attachments)
1529_605d88e1d1a14_656614.pdf
180 KBs PDF File
1529_605d88e1d1a14_656614.docx
120 KBs Word File