What determines whether organizations fire their leaders? It's often hard for outsiders to observe performance, but in
Question:
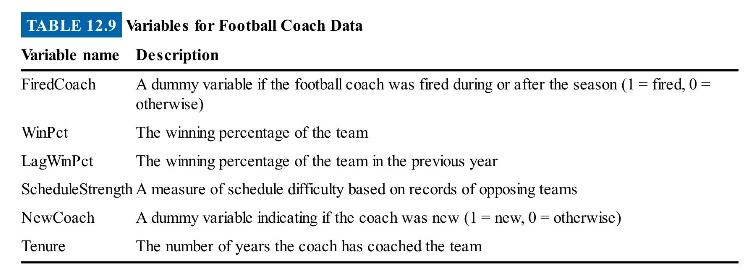
What determines whether organizations fire their leaders? It's often hard for outsiders to observe performance, but in sports, many facets of performance (particularly winning percentage) are easily observed. Michael Roach (2013) provides data on the performance and firing of NFL football coaches. Table 12.9 lists the variables.
(a) Run a probit model explaining whether the coach was fired as a function of winning percentage. Graph fitted values from this model on same graph with fitted values results from a bivariate LPM (use the lfit command to plot LPM results). Explain the differences in the plots.
(b) Estimate LPM, probit, and logit models of coach firings by using winning percentage, lagged winning percentage, a new coach dummy, strength of schedule, and coach tenure as independent variables. Are the coefficients substantially different? How about the z statistics?
(c) Indicate the minimum, mean, and maximum of the fitted values for each model, and briefly discuss each.
(d) What are the correlations of the three fitted values?
(e) It's kind of odd to say that lag winning percentage affects the probability that new coaches were fired because they weren't coaching for the year associated with the lagged winning percentage. Include an interaction for the new coach dummy variable and lagged winning percentage. The effect of lagged winning percentage on probability of being fired is the sum of the coefficients on lagged winning percentage and the interaction. Test the null hypothesis that lagged winning percentage has no effect on new coaches (meaning coaches for whom NewCoach \(=1\) ). Use a Wald test (which is most convenient) and a LR test.

Step by Step Answer:

Real Econometrics The Right Tools To Answer Important Questions
ISBN: 9780190857462
2nd Edition
Authors: Michael Bailey


