

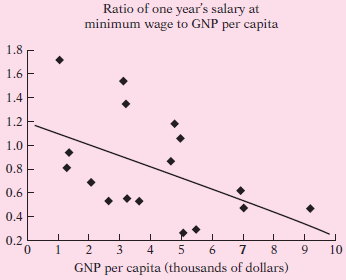
What does the scattergram in Figure 2.10 reveal? On the basis of this diagram, would you argue
Question:
Fantastic news! We've Found the answer you've been seeking!
Step by Step Answer:
This figure shows that the higher is the minimum wage the lower is per ...View the full answer

Answered By
Aqib Parvej
I am teaching since my graduation time so I have teaching experience of about 5 years and in these years I learn to teach in the best and interesting way .
20+ Reviews
41+ Question Solved
Related Book For 

Question Posted:
