

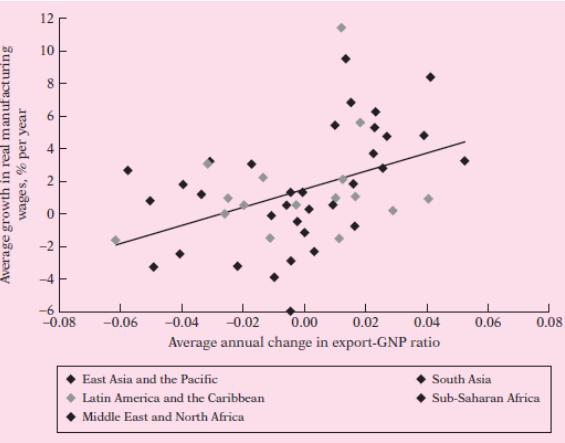
You are given the scattergram in Figure 2.8 along with the regression line. What general conclusion do
Question:
Fantastic news! We've Found the answer you've been seeking!
Step by Step Answer:
This scattergramshows that more exportoriented countries on average ...View the full answer

Answered By
Hillary Waliaulah
As a tutor, I am that experienced with over 5 years. With this, I am capable of handling a variety of subjects.
17+ Reviews
30+ Question Solved
Related Book For 

Question Posted:
