Draw a graph of the U.S. market for roses to illustrate the gains and losses from the
Question:
Draw a graph of the U.S. market for roses to illustrate the gains and losses from the tariff and on the graph identify the gains and losses, the tariff revenue, and the deadweight loss created.
a. Without international trade, what would be the price of a container of roses and how many containers of roses a year would be bought and sold in the United States?
b. At the price in your answer to part (a), does the United States or the rest of the world have a comparative advantage in producing roses?
Wholesalers buy and sell roses in containers that hold 120 stems. The table provides information about the wholesale market for roses in the United States. The demand schedule is the wholesalers’ demand and the supply schedule is the U.S. rose growers’ supply.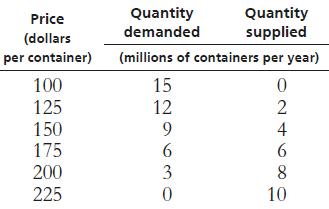
Step by Step Answer:

This question has not been answered yet.
You can Ask your question!