

Household income data, by quintile, for Sweden and South Africa are given in the following table. There
Question:
Household income data, by quintile, for Sweden and South Africa are given in the following table. There is also Gini coefficient data. 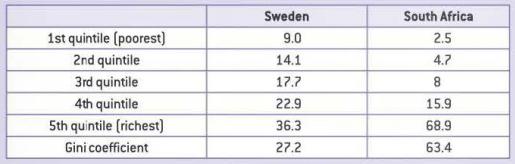
a) On one graph, plot accurate Lorenz curves for both countries.
b) Comment on the difference in the distribution of income between the two countries.
c) Using the values for the Gini coefficients given in the last row, comment on the relationship between the Lorenz curve and the Gini coefficient.
Step by Step Answer:

This question has not been answered yet.
You can Ask your question!
Related Book For 

Question Posted:
