

Question: Plot a sensitivity graph for annual worth versus initial cost, annual revenue, and salvage value for the data in the table below. Vary only one
Plot a sensitivity graph for annual worth versus initial cost, annual revenue, and salvage value for the data in the table below. Vary only one parameter at a time, each within the range of -20 percent to +20 percent. MARR is 20 percent/year. Project life is 10 years. Based on your graph, which parameter shows the most sensitivity? The least?
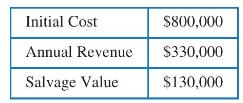
Initial Cost $800,000 Annual Revenue $330,000 Salvage Value $130,000
Step by Step Solution
★★★★★
3.46 Rating (153 Votes )
There are 3 Steps involved in it
1 Expert Approved Answer
Step: 1 Unlock

graph required m... View full answer
Question Has Been Solved by an Expert!
Get step-by-step solutions from verified subject matter experts
Step: 2 Unlock
Step: 3 Unlock