

Question: Plot a sensitivity graph for annual worth versus initial cost, annual revenue, and salvage value for the data in the table below. Vary only one
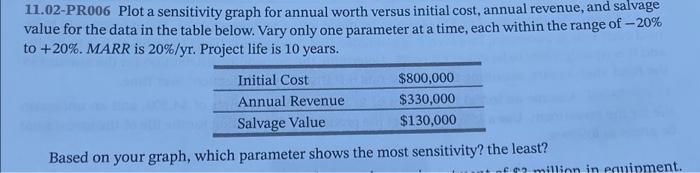
11.02-PR006 Plot a sensitivity graph for annual worth versus initial cost, annual revenue, and salvage value for the data in the table below. Vary only one parameter at a time, each within the range of 20% to +20%. MARR is 20%/yr. Project life is 10 years. Based on your graph, which parameter shows the most sensitivity? the least? 11.02-PR006 Plot a sensitivity graph for annual worth versus initial cost, annual revenue, and salvage value for the data in the table below. Vary only one parameter at a time, each within the range of 20% to +20%. MARR is 20%/yr. Project life is 10 years. Based on your graph, which parameter shows the most sensitivity? the least
Step by Step Solution
There are 3 Steps involved in it

Get step-by-step solutions from verified subject matter experts