

The following figure illustrates the circular flow model. During 2021, flow A was $13.0 trillion, flow B
Question:
The following figure illustrates the circular flow model.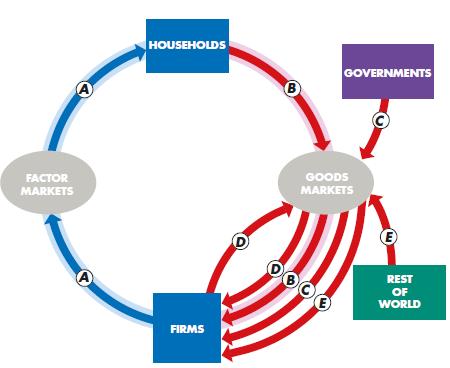
During 2021, flow A was $13.0 trillion, flow B was $9.1 trillion, flow D was $3.3 trillion, and flow E was −$0.8 trillion. Calculate (i) GDP and (ii) government expenditure.
Fantastic news! We've Found the answer you've been seeking!
Step by Step Answer:
Certainly based on the circular flow model youve described we can calculate GDP and government expen...View the full answer

Answered By
Muhammad Umair
I have done job as Embedded System Engineer for just four months but after it i have decided to open my own lab and to work on projects that i can launch my own product in market. I work on different softwares like Proteus, Mikroc to program Embedded Systems. My basic work is on Embedded Systems. I have skills in Autocad, Proteus, C++, C programming and i love to share these skills to other to enhance my knowledge too.
1+ Reviews
10+ Question Solved
Related Book For 
Question Posted:
