The table below lists for 2018 the five states with the highest real GDP per capita and
Question:
The table below lists for 2018 the five states with the highest real GDP per capita and the five states with the lowest real GDP per capita. The table shows each state’s level of real GDP per capita and its growth rate of real GDP per capita in that year.
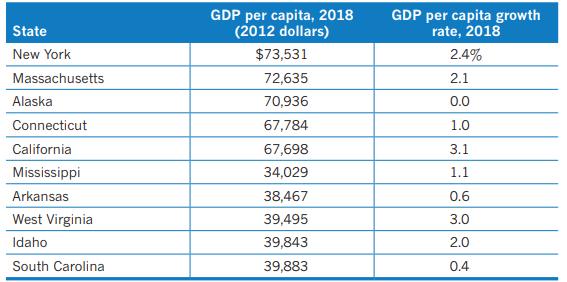
a. With the growth rate of real GDP per capita on the y-axis and the level of real GDP per capita on the x-axis, plot the points from the table in a graph. Each point should represent the combination of real GDP per capita and the growth rate of real GDP per capita for a state.
b. Based on the information in the table as displayed in your graph, do the highestincome states and the lowest-income states exhibit convergence or catch-up? Briefly explain.
c. What additional data would you need to more accurately test if the lowest-income states are catching up?
Step by Step Answer:

This question has not been answered yet.
You can Ask your question!