

Question: Use the data in Problem 2 to work Problem 5. a. Use a graph to illustrate the producer surplus generated from Minnies Mineral Springs water
Use the data in Problem 2 to work Problem 5.
a. Use a graph to illustrate the producer surplus generated from Minnie’s Mineral Springs’
water production and consumption.
b. Is Minnie’s an efficient producer of water?
Explain your answer.
c. Suppose that new wells were discovered nearby to Minnie’s and Minnie’s faced competition from new producers. Explain what would happen to Minnie’s output, price, and profit.
Problem 2
Calculate Minnie’s marginal revenue schedule and draw a graph of the market demand curve and Minnie’s marginal revenue curve. Explain why Minnie’s marginal revenue is less than the price.
Minnie’s Mineral Springs is a single-price monopoly.
Columns 1 and 2 of the table set out the market demand schedule for Minnie’s water and columns 2 and 3 set out Minnie’s total cost schedule.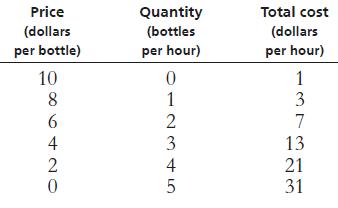
Price (dollars per bottle) 10 8 6 4 2 20 0 Quantity (bottles per hour) 0 12345 2 4 Total cost (dollars per hour) 1 3 7 13 21 31
Step by Step Solution
3.39 Rating (143 Votes )
There are 3 Steps involved in it

Get step-by-step solutions from verified subject matter experts