

Question: Exhibit 1 Leading Country Markets for Bottled Water, 1999, 2004 (in millions of gallons) CAGR= Compound annual growth rate Source: Beverage Marketing Corporation as reported
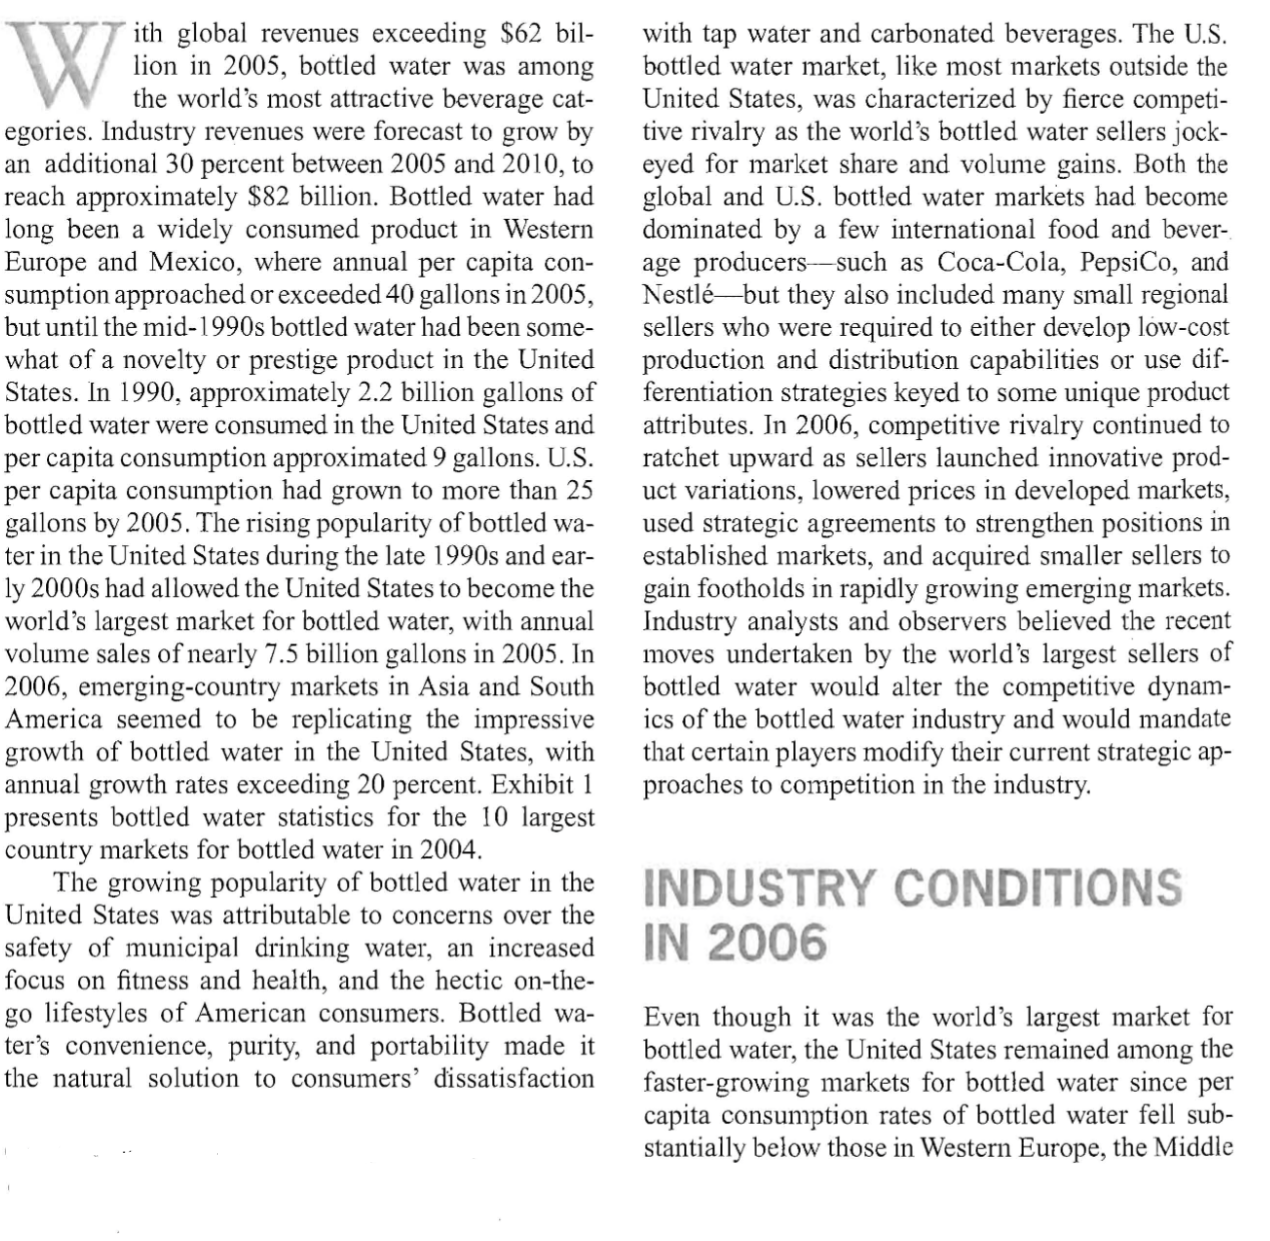
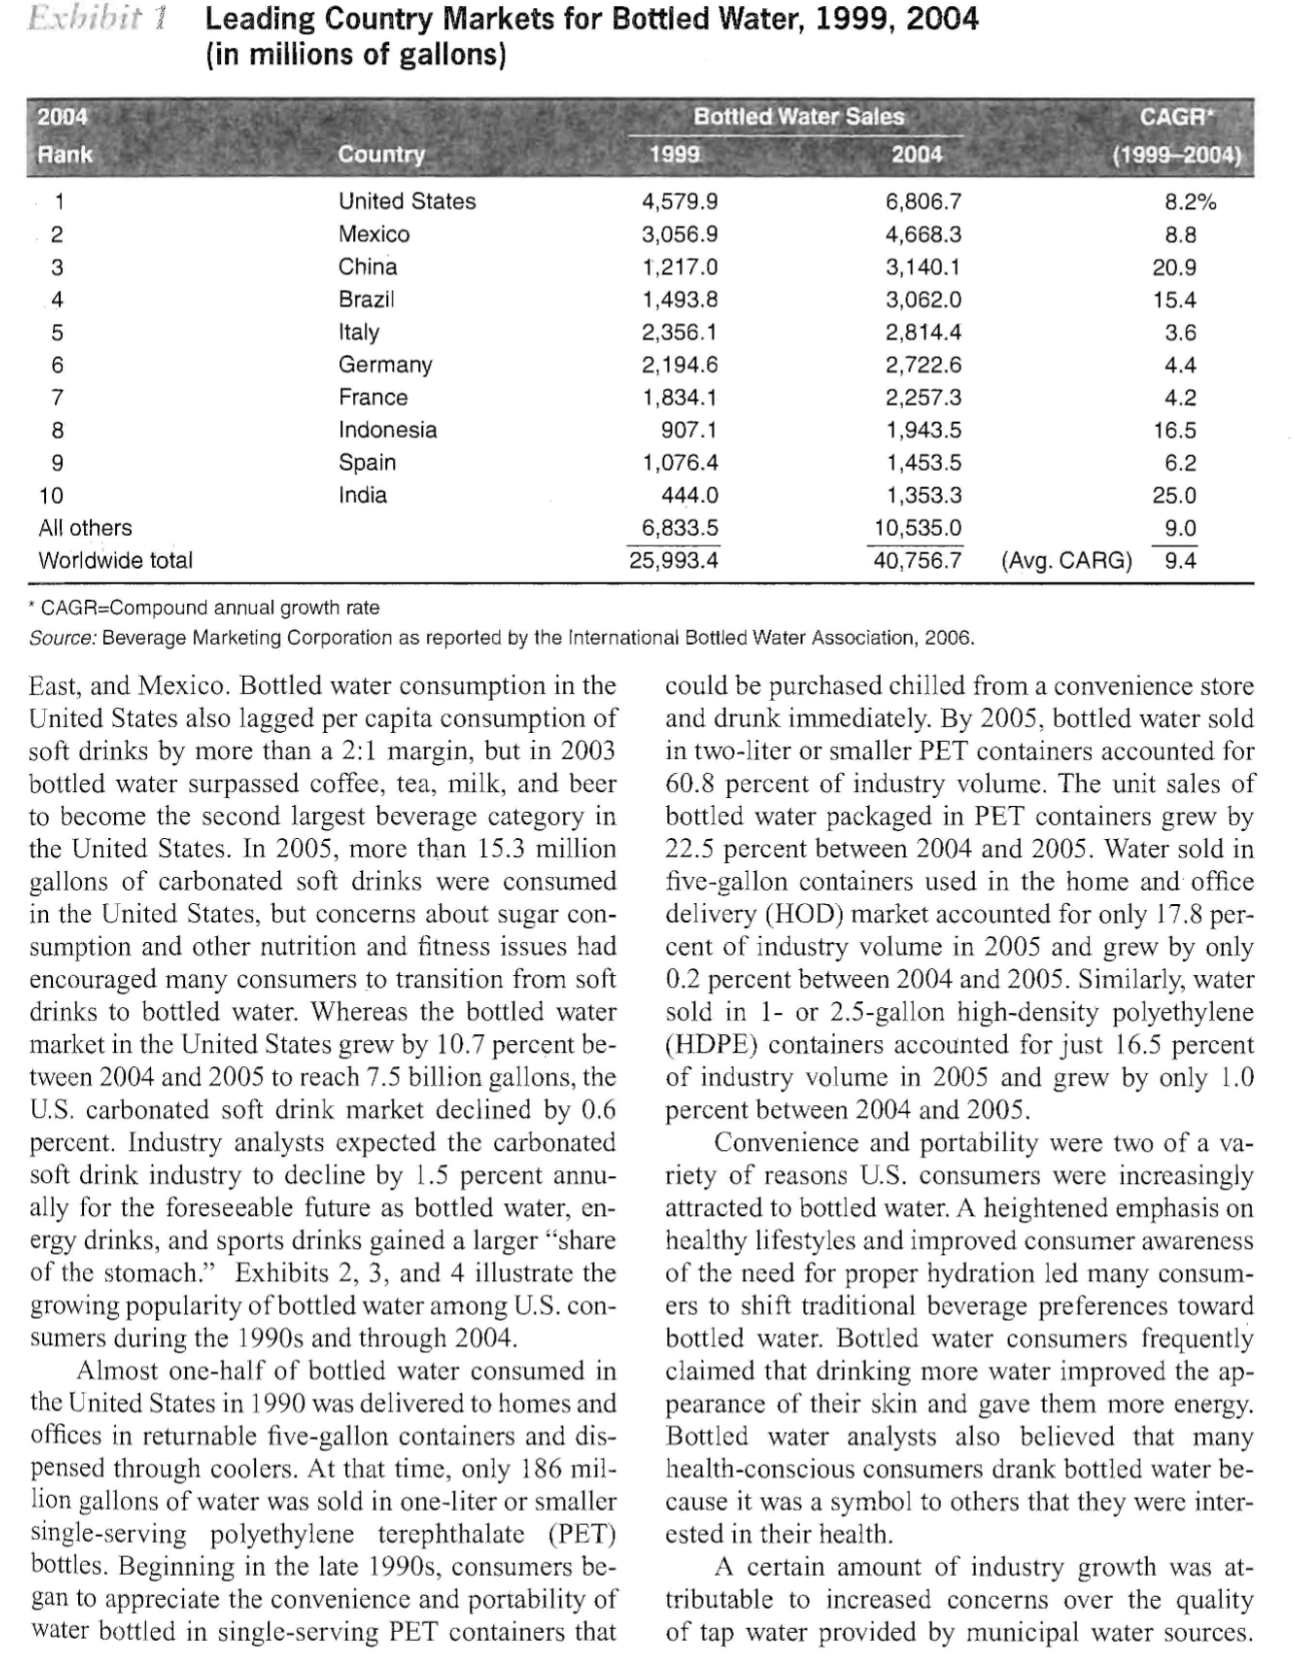
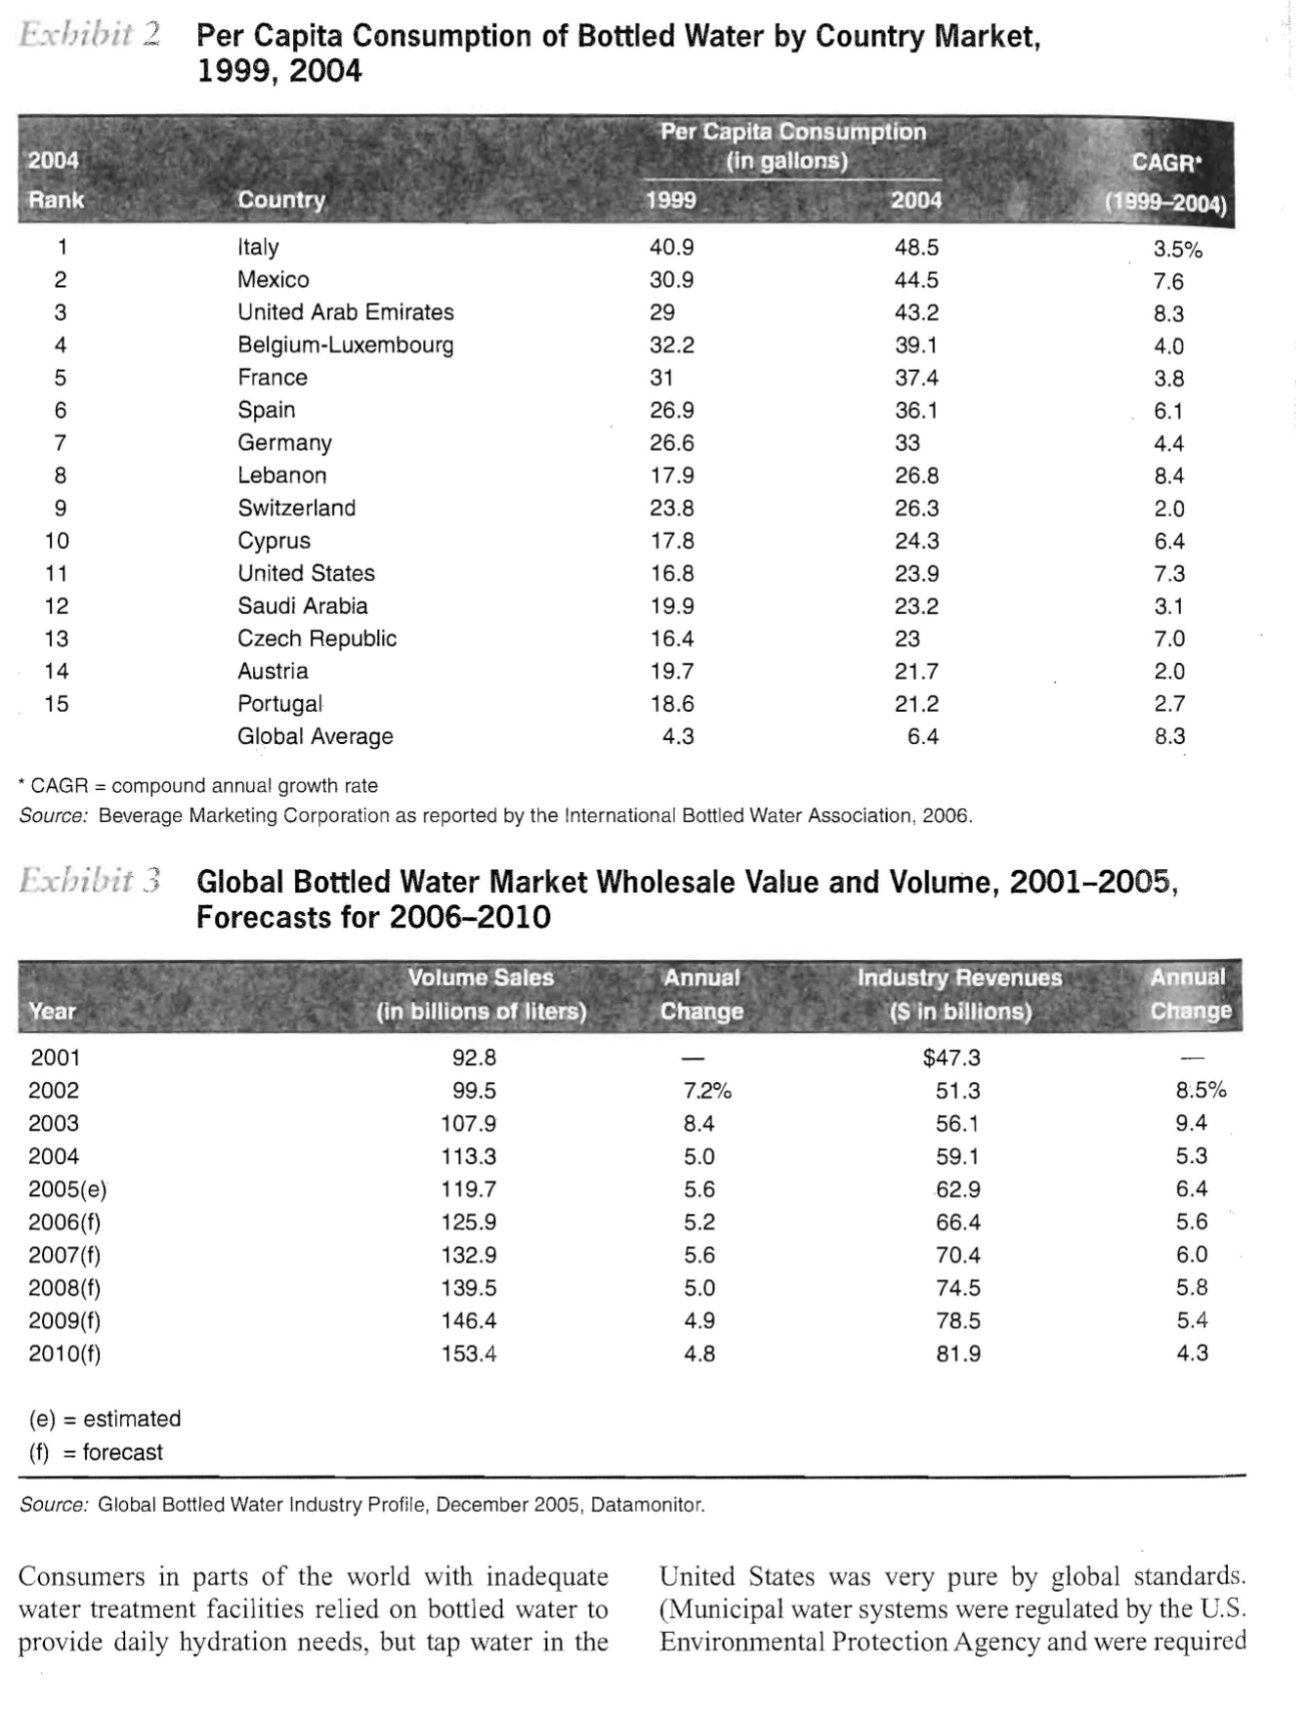
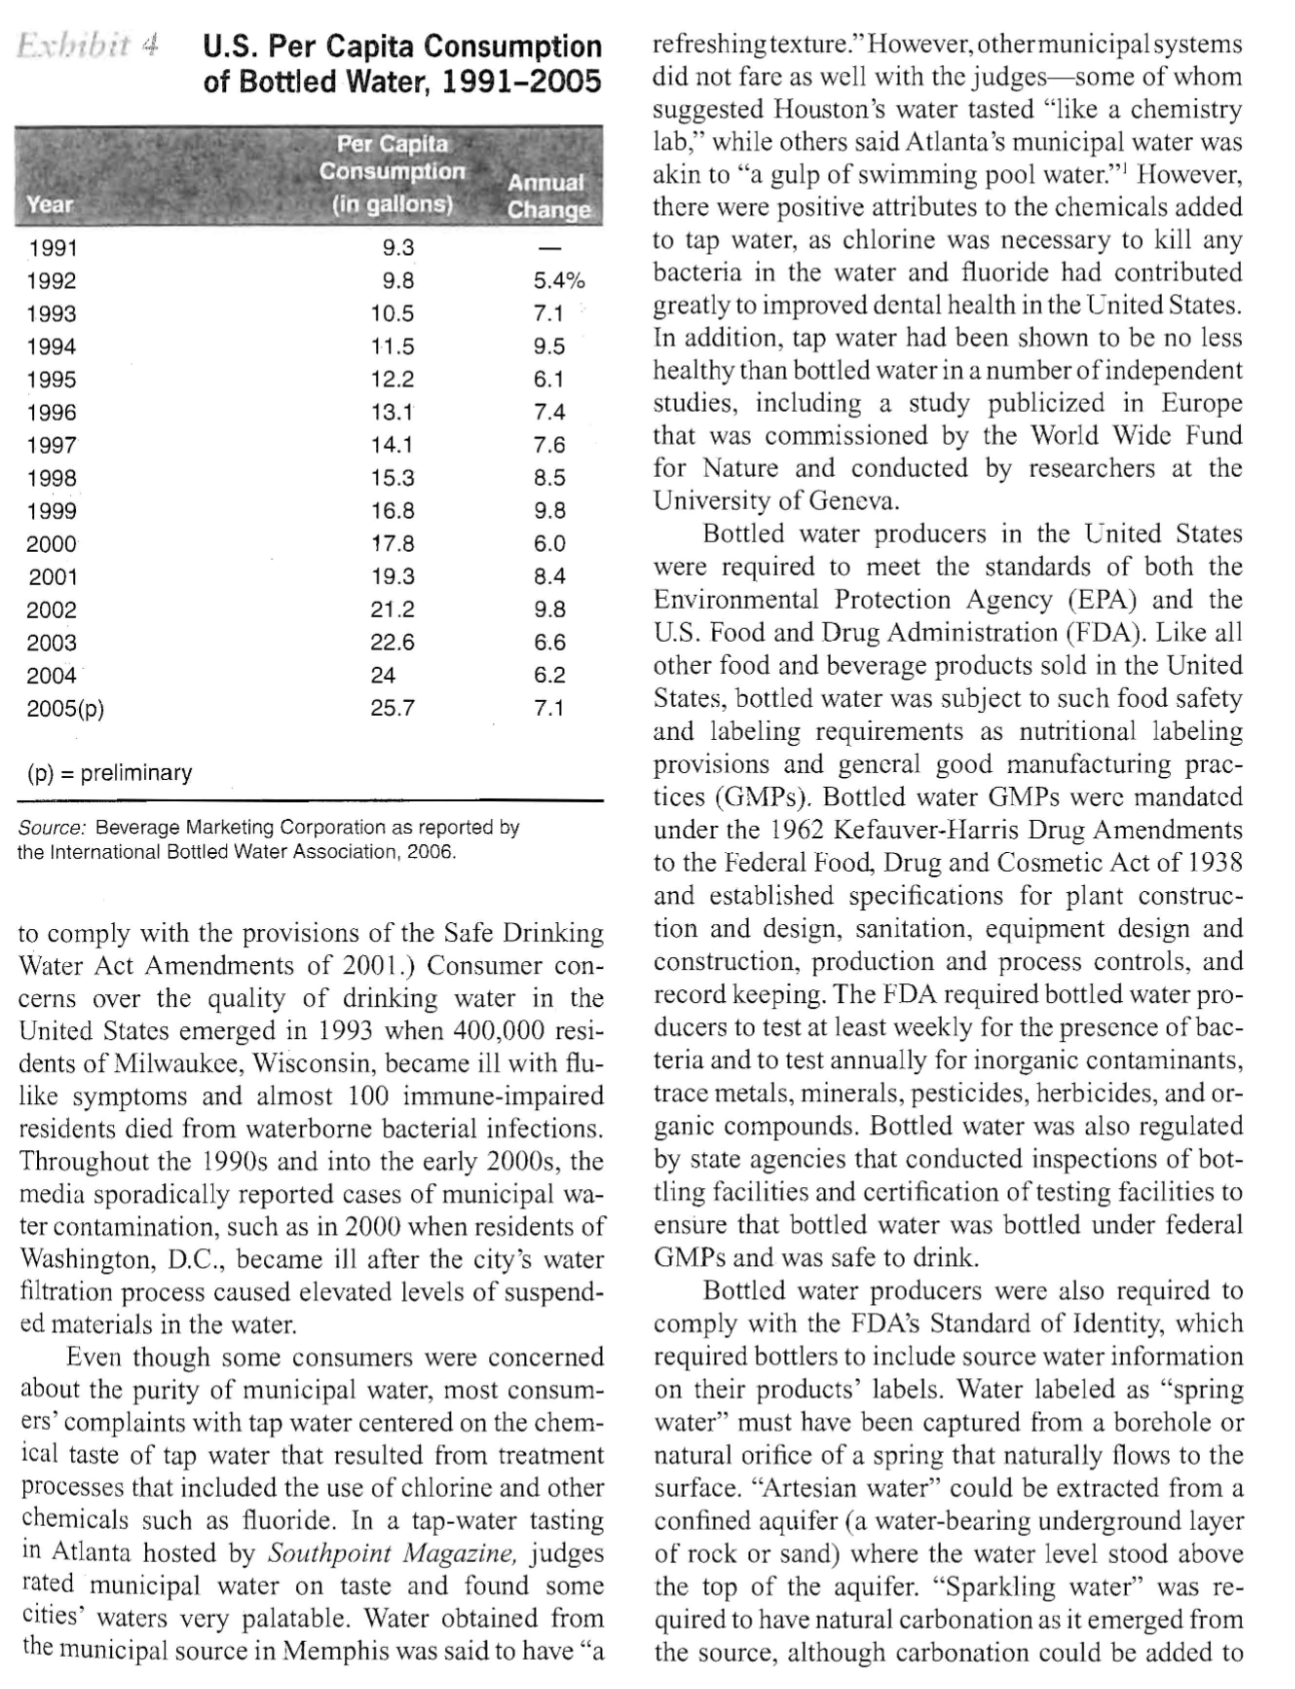
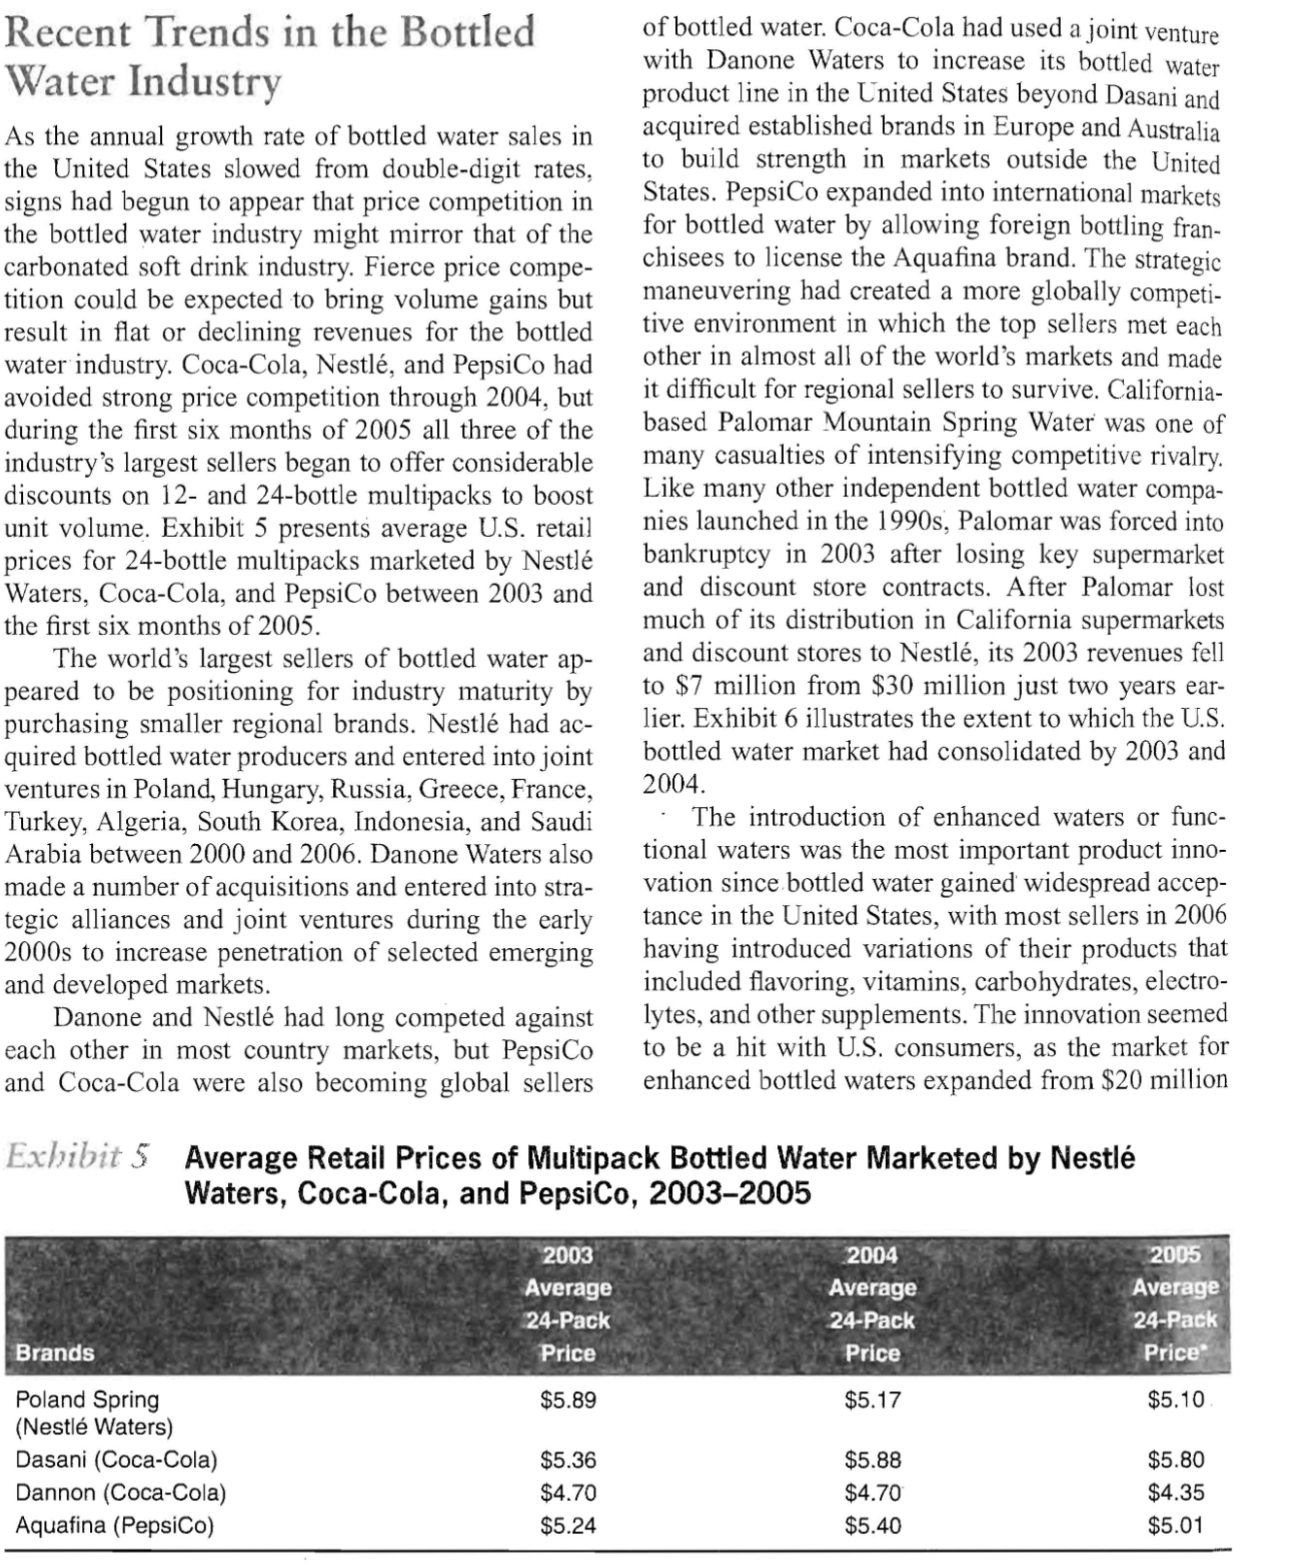
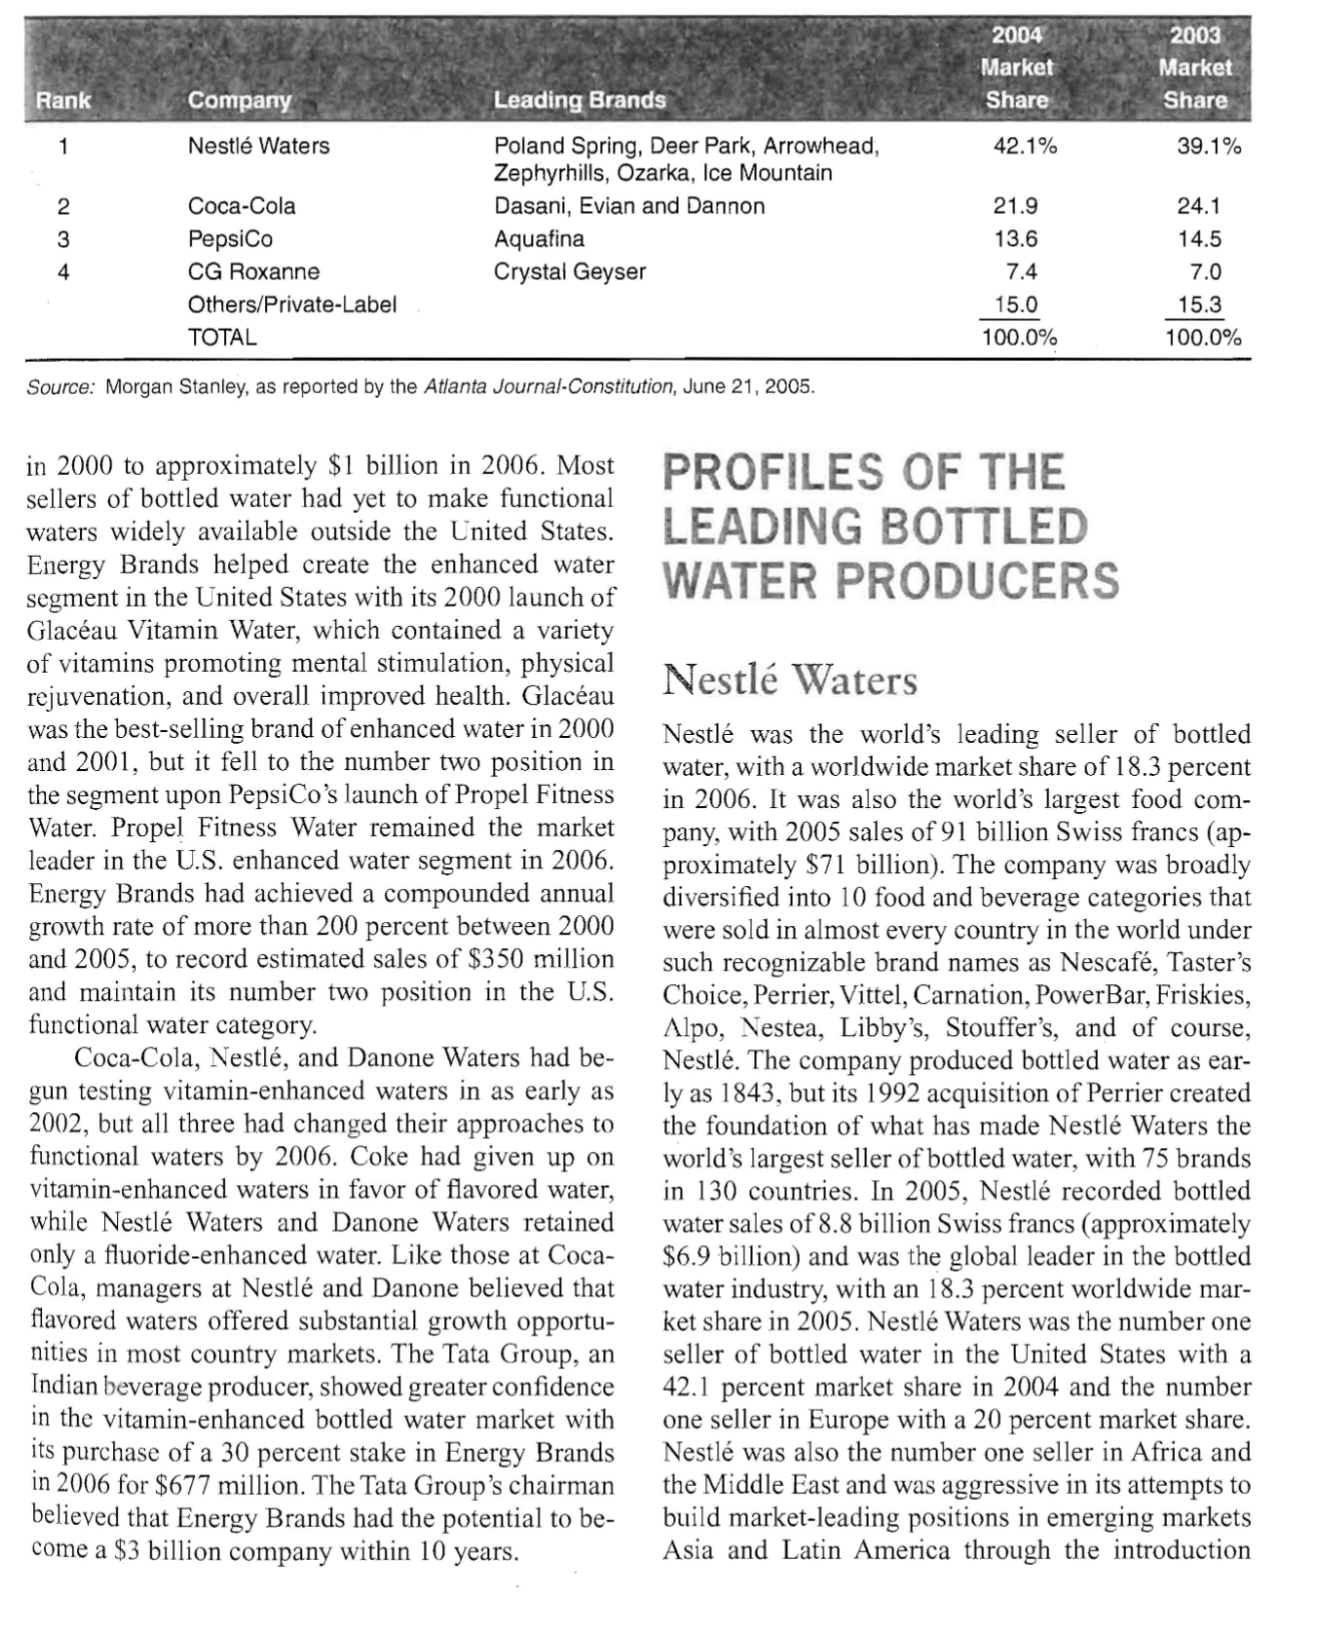
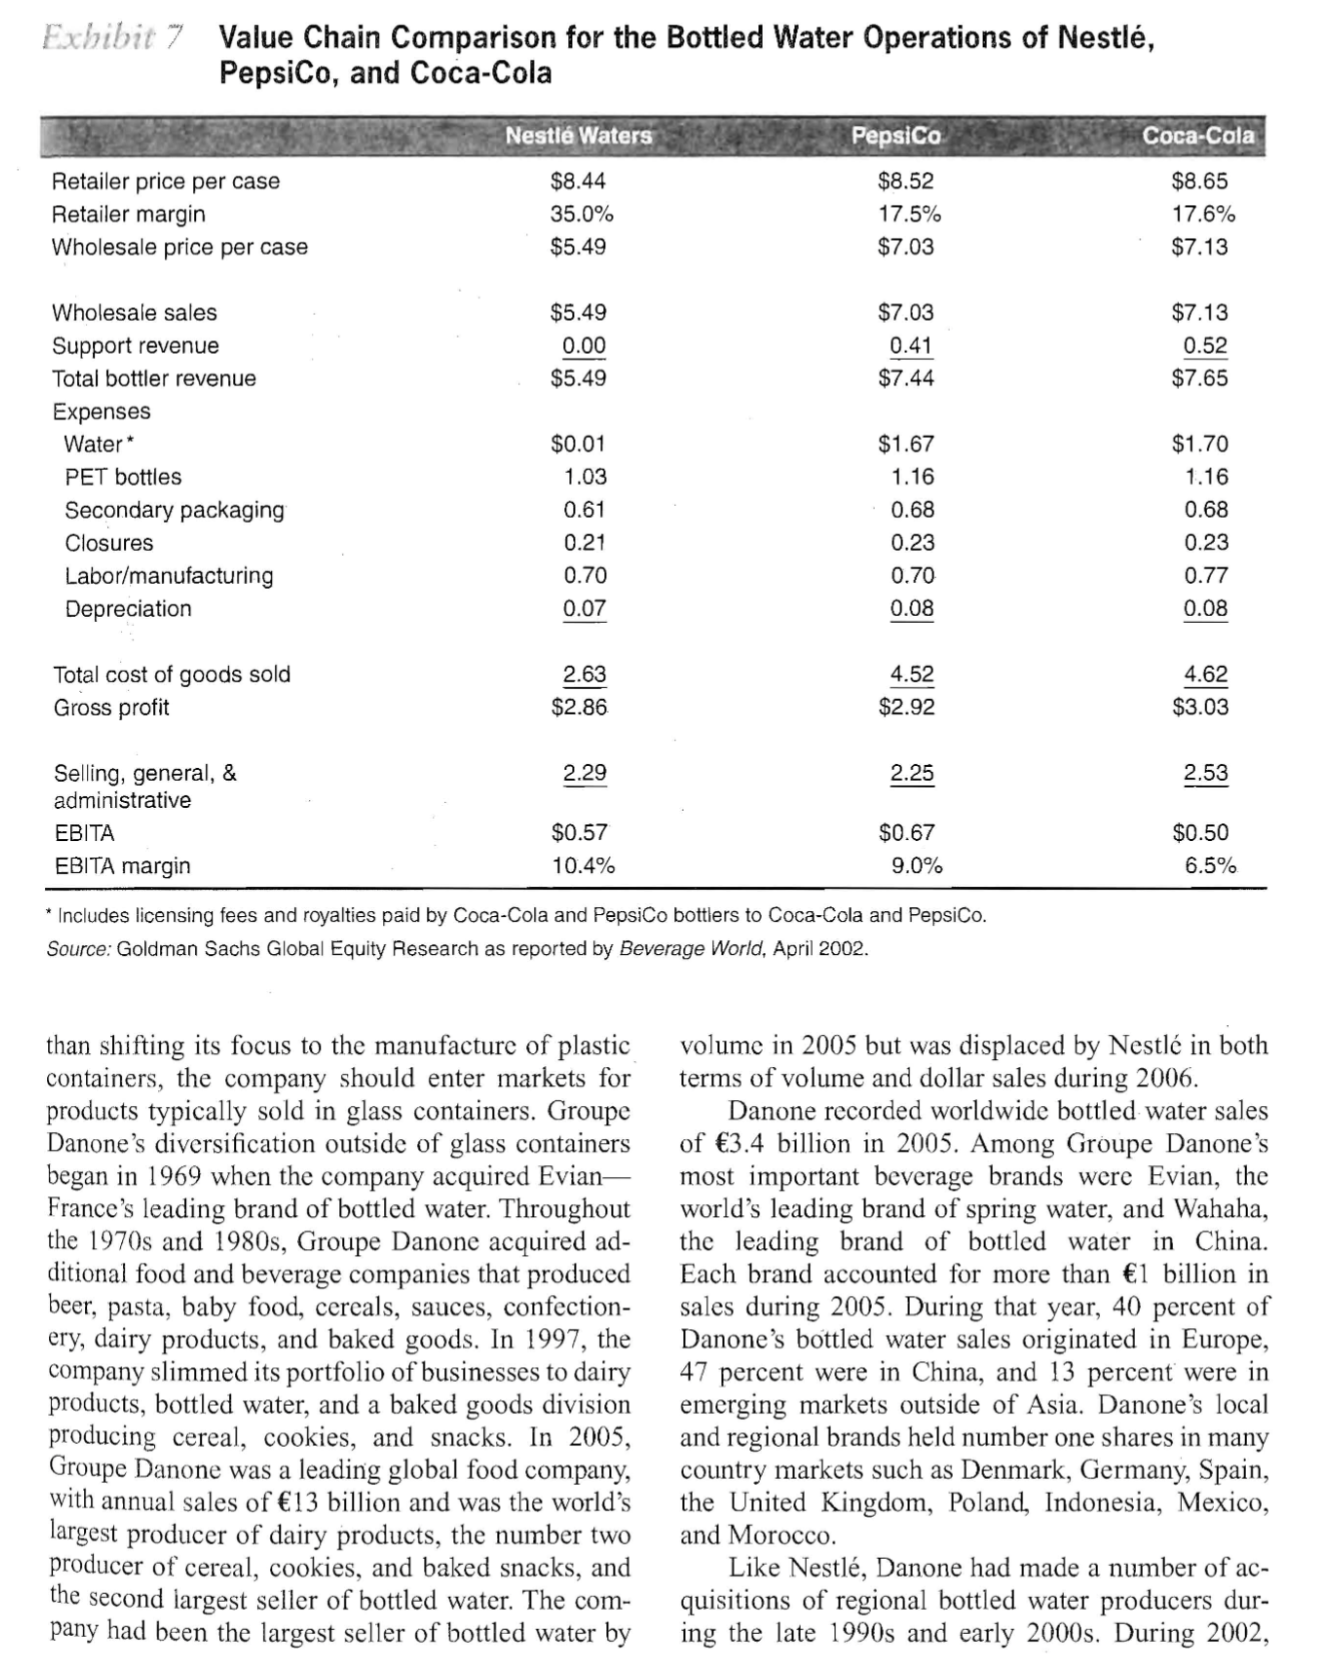
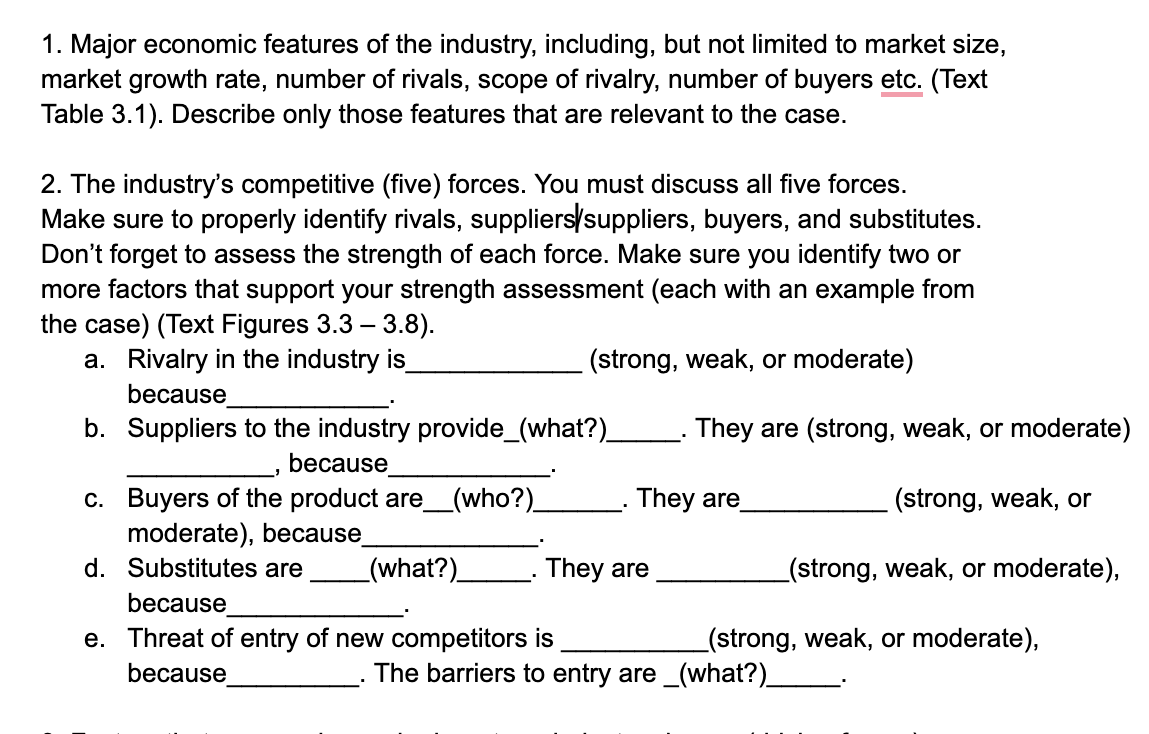
Exhibit 1 Leading Country Markets for Bottled Water, 1999, 2004 (in millions of gallons) CAGR= Compound annual growth rate Source: Beverage Marketing Corporation as reported by the International Bottled Water Association, 2006. East, and Mexico. Bottled water consumption in the United States also lagged per capita consumption of soft drinks by more than a 2:1 margin, but in 2003 bottled water surpassed coffee, tea, milk, and beer to become the second largest beverage category in the United States. In 2005, more than 15.3 million gallons of carbonated soft drinks were consumed in the United States, but concerns about sugar consumption and other nutrition and fitness issues had encouraged many consumers to transition from soft drinks to bottled water. Whereas the bottled water market in the United States grew by 10.7 percent between 2004 and 2005 to reach 7.5 billion gallons, the U.S. carbonated soft drink market declined by 0.6 percent. Industry analysts expected the carbonated soft drink industry to decline by 1.5 percent annually for the foreseeable future as bottled water, energy drinks, and sports drinks gained a larger "share of the stomach." Exhibits 2,3, and 4 illustrate the growing popularity of bottled water among U.S. consumers during the 1990s and through 2004. Almost one-half of bottled water consumed in the United States in 1990 was delivered to homes and offices in returnable five-gallon containers and dispensed through coolers. At that time, only 186 million gallons of water was sold in one-liter or smaller single-serving polyethylene terephthalate (PET) bottles. Beginning in the late 1990s, consumers began to appreciate the convenience and portability of water bottled in single-serving PET containers that could be purchased chilled from a convenience store and drunk immediately. By 2005, bottled water sold in two-liter or smaller PET containers accounted for 60.8 percent of industry volume. The unit sales of bottled water packaged in PET containers grew by 22.5 percent between 2004 and 2005. Water sold in five-gallon containers used in the home and office delivery (HOD) market accounted for only 17.8 percent of industry volume in 2005 and grew by only 0.2 percent between 2004 and 2005. Similarly, water sold in 1- or 2.5-gallon high-density polyethylene (HDPE) containers accounted for just 16.5 percent of industry volume in 2005 and grew by only 1.0 percent between 2004 and 2005. Convenience and portability were two of a variety of reasons U.S. consumers were increasingly attracted to bottled water. A heightened emphasis on healthy lifestyles and improved consumer awareness of the need for proper hydration led many consumers to shift traditional beverage preferences toward bottled water. Bottled water consumers frequently claimed that drinking more water improved the appearance of their skin and gave them more energy. Bottled water analysts also believed that many health-conscious consumers drank bottled water because it was a symbol to others that they were interested in their health. A certain amount of industry growth was attributable to increased concerns over the quality of tap water provided by municipal water sources. ith global revenues exceeding $62 billion in 2005, bottled water was among the world's most attractive beverage categories. Industry revenues were forecast to grow by an additional 30 percent between 2005 and 2010, to reach approximately $82 billion. Bottled water had long been a widely consumed product in Western Europe and Mexico, where annual per capita consumption approached or exceeded 40 gallons in 2005 , but until the mid-1990s bottled water had been somewhat of a novelty or prestige product in the United States. In 1990, approximately 2.2 billion gallons of bottled water were consumed in the United States and per capita consumption approximated 9 gallons. U.S. per capita consumption had grown to more than 25 gallons by 2005 . The rising popularity of bottled water in the United States during the late 1990s and early 2000s had allowed the United States to become the world's largest market for bottled water, with annual volume sales of nearly 7.5 billion gallons in 2005 . In 2006, emerging-country markets in Asia and South America seemed to be replicating the impressive growth of bottled water in the United States, with annual growth rates exceeding 20 percent. Exhibit 1 presents bottled water statistics for the 10 largest country markets for bottled water in 2004. The growing popularity of bottled water in the United States was attributable to concerns over the safety of municipal drinking water, an increased focus on fitness and health, and the hectic on-thego lifestyles of American consumers. Bottled water's convenience, purity, and portability made it the natural solution to consumers' dissatisfaction with tap water and carbonated beverages. The U.S. bottled water market, like most markets outside the United States, was characterized by fierce competitive rivalry as the world's bottled water sellers jockeyed for market share and volume gains. Both the global and U.S. bottled water markets had become dominated by a few international food and beverage producers--such as Coca-Cola, PepsiCo, and Nestl - but they also included many small regional sellers who were required to either develop low-cost production and distribution capabilities or use differentiation strategies keyed to some unique product attributes. In 2006, competitive rivalry continued to ratchet upward as sellers launched innovative product variations, lowered prices in developed markets, used strategic agreements to strengthen positions in established markets, and acquired smaller sellers to gain footholds in rapidly growing emerging markets. Industry analysts and observers believed the recent moves undertaken by the world's largest sellers of bottled water would alter the competitive dynamics of the bottled water industry and would mandate that certain players modify their current strategic approaches to competition in the industry. INDUSTRY CONDITIONS IN 2006 Even though it was the world's largest market for bottled water, the United States remained among the faster-growing markets for bottled water since per capita consumption rates of bottled water fell substantially below those in Western Europe, the Middle of global Nestl products and the acquisition of established local brands. The company acquired nearly 20 bottled water producers between 2001 and 2003. In 2006, Nestl Waters was the number one brand of bottled water in Pakistan, Vietnam, and Cuba; the number two brand in Indonesia and Argentina; and the number three brand in Thailand. The company's bottled water portfolio in 2006 included two global brands (Nestl Pure Life and Nestl Aquarel), five international premium brands (Perrier, Vittel, Contrex, Acqua Panna, and S. Pellegrino), and 68 local brands. Nestl Pure Life was a purified water product developed in 1998 for emerging markets and other markets in which spring water was not an important differentiating feature of bottled water. Nestl Aquarel was developed in 2000 for the European market and markets that preferred still spring water over purified water or sparkling spring water. Nestl's other waters marketed in Europe were either spring water with a higher mineral content or sparkling waters such as Perrier and S. Pellegrino. Almost all brands marketed outside of Europe were either spring water or mineral water with no carbonation. Its brands in the United States included Pure Life, Arrowhead, Ice Mountain, Calistoga, Deer Park, Zephyrhills, Ozarka, and Poland Spring. During the early 2000s, Nestl Waters management believed that its broad portfolio of local water brands was among the company's key resource strengths. However, the notable success of Nestle's two global brands had caused management to reorganize the division in 2006. Pure Life and Aquarel had grown from just 2.5 percent of the division's sales in 2002 to 12.0 percent of the division's 2005 sales. Consumers in the United States seemed to accept the Pure Life brand as well as long-established local brands, with sales of Nestle Pure Life in the United States increasing by 50 percent between 2004 and 2005. Flavored varieties of Pure Life had also achieved notable success in Canada by capturing a 70 percent share of the flavored water market within the first six months on the market. Nestle's 68 local brands had accounted for as much as 75.7 percent of division sales in 2002 , but local brands had declined to 64.8 percent of sales in 2005 . The company's five premium international brands accounted for an additional 23.2 percent of 2005 sales. Nestl had test-marketed functional waters fortified with vitamins and plant extracts between 2003 and 2004, but offered only fruit-flavored enhanced waters in 2006. Contrex Lemon Meringue and Strawberry Melba were two innovative caloriefree flavors introduced in 2006. The company had also used packaging innovations to differentiate its bottled water brands, including a spill-proof cap for child-sized bottles of Poland Spring, Deer Park, and Arrowhead. Nestl Waters also developed a bubble-shaped bottle that was designed to appeal to children. Perrier's new PET container was part of a strategy to revitalize the prestigious brand, which had experienced annual sales declines since the mid-1990s. The new plastic bottle was intended to better match the on-the-go lifestyles of young consumers than Perrier's heavy one-liter glass containers. Nestl would still package Perrier in glass bottles for consumers who preferred the brand's traditional packaging for dinner parties and other formal settings. Home and office delivery (HOD) was also an important component of Nestl's strategy-especially in North America, Europe, and the Middle East. HOD made up nearly 30 percent of Nestl Waters' sales volume in the United States and was recording double-digit growth in most other country markets in 2005. In 2005, Nestl competed in the HOD market for bottled water in 30 countries. Between 2000 and 2004, the company had made 8 acquisitions in the European HOD segment to grow from no presence to the leading position, with 32 percent market share. Nestl had also made acquisitions and entered into joint ventures to develop market leading positions in countries located in the Middle East, Northern Africa, and the Far East. Nestl's market leading positions in Europe and the United States in HOD and PET channels allowed it to earn the status of low-cost leader in the United States. Exhibit 7 illustrates Nestl Waters' cost and wholesale pricing advantages relative to Coca-Cola and PepsiCo in U.S. markets. Nestl Waters' management stated in mid-2002 that it expected to double the division's revenues by 2010 . Groupe Danone Groupe Danone was established through the 1966 merger of two of France's leading glass makers, who foresaw the oncoming acceptability of plastic as a substitute to glass containers. The management of the newly merged company believed that, rather 1. Major economic features of the industry, including, but not limited to market size, market growth rate, number of rivals, scope of rivalry, number of buyers etc. (Text Table 3.1). Describe only those features that are relevant to the case. 2. The industry's competitive (five) forces. You must discuss all five forces. Make sure to properly identify rivals, suppliers/suppliers, buyers, and substitutes. Don't forget to assess the strength of each force. Make sure you identify two or more factors that support your strength assessment (each with an example from the case) (Text Figures 3.3-3.8). a. Rivalry in the industry is (strong, weak, or moderate) because b. Suppliers to the industry provide_(what?) They are (strong, weak, or moderate) , because c. Buyers of the product are__(who?) They are (strong, weak, or moderate), because d. Substitutes are (what?) They are (strong, weak, or moderate), because e. Threat of entry of new competitors is (strong, weak, or moderate), because The barriers to entry are _(what?) Danone acquired a controlling interest in Poland's leading brand of bottled water for an undisclosed amount and purchased Canada's Sparkling Spring brand of waters for an estimated $300$400 million. The company also entered into a joint venture with Kirin Beverage Company to strengthen its distribution network in Japan and embarked on a partnership with the Rachid Group, an Egyptian firm, to accelerate its development of market opportunities in North Africa and the Near and Middle East. During 2003 and 2004, Groupe Danone acquired three HOD bottled water sellers in Mexico. Danone acquired the leading brand of bottled water in Serbia and an HOD seller in Spain in 2004. In 2006, the company acquired a 49 percent stake in Denmark's leading seller of bottled water. Danone Waters' revenues had declined by nearly 20 percent between 2000 and 2005 as its U.S. distribution agreement with Coca-Cola began to suffer. Prior to Coca-Cola's launch of Dasani, its bottlers distributed Evian and other non-Coke bottled water brands. Before the introduction of Dasani, about 60 percent of Evian's U.S. distribution was handled by Coca-Cola bottlers. With Coca-Cola bottler's attention directed toward the sale of Dasani, Evian lost shelf space in many convenience stores, supermarkets, delis, restaurants, and wholesale clubs. Danone Waters and Coca-Cola entered into a joint venture in 2002 that allowed Evian and Dannon water brands to be distributed along with Dasani to convenience stores, supermarkets, and other retail locations serviced by Coca-Cola's bottling operations. In addition, the agreement made Coke responsible for the production, marketing and distribution of Dannon in the United States. Coca-Cola provided Danone an up-front cash payment in return for 51 percent ownership of the joint venture. Danone contributed its five plants and other bottled water assets located in the United States to the joint venture. However, Evian and Dannon continued to suffer under the new distribution arrangement as Coca-Cola continued to put most of its marketing muscle behind Dasani. Danone sold its 49 percent interest in the North American bottled water joint venture to Coca-Cola in 2005. Danone's home and office delivery businesses were not included in the agreement with Coca-Cola and were combined with Suntory Water Group's assets to form DS Waters in 2003. The combination of Danone Waters' and Suntory Waters assets made the joint venture the largest HOD distributor in the United States, with sales of approximately $800 million. Brands marketed by DS Waters included Alhambra, Crystal Springs, Sierra Springs, Hinckley Springs, Kentwood Springs, Belmont Springs, and Sparkletts. Groupe Danone and Suntory sold 100 percent of DS Waters to a private investment fund in 2005 for an undisclosed sum. The sale resulted in a 315 million loss for Groupe Danone and completed Groupe Danone's exit from the North American bottled water market. Danone's HOD business remained the worldwide leader in the category with number one rankings in Asia, Argentina, and Canada. Groupe Danone was the second largest HOD provider in Europe in 2005 through a joint venture with Swiss-based Eden Springs. Groupe Danone had made functional and flavored waters a strategic priority for its beverage business. The company introduced flavored and vitamin-rich versions of Volvic in Europe during 2003 and 2004, and by 2005 it was selling flavored and functional waters in most of its markets. The company held a number one ranking in functional beverage categories in New Zealand and Argentina. Functional and flavored waters accounted for 25 percent of the group's beverage sales in 2005 . The Coca-Cola Company With 300 brands worldwide, the Coca-Cola Company was the world's leading manufacturer, marketer, and distributor of nonalcoholic beverage concentrates. The company produced soft drinks, juice and juice drinks, sports drinks, water, and coffee and was best known for Coca-Cola, which has been called the world's most valuable brand. In 2005, the company sold more than 20.6 billion cases of beverages worldwide to record revenues of $23.1 billion. CocaCola's net income for 2005 was nearly $4.9 billion. Seventy-three percent of Coke's gallon sales were generated outside of North America, with four international markets (Mexico, Brazil, China, and Japan) accounting for 27 percent of Coca-Cola's sales by volume. Sales in the United States also accounted for 27 percent of the company's total volume. Along with the universal appeal of the Coca-Cola brand, Coca-Cola's vast global distribution system that included independent bottlers, bottlers partially owned by Coca-Cola, and company-owned bottlers made Coke an almost unstoppable international Source: Morgan Stanley, as reported by the Atlanta Journal-Constitution, June 21, 2005. in 2000 to approximately $1 billion in 2006. Most sellers of bottled water had yet to make functional waters widely available outside the Lnited States. Energy Brands helped create the enhanced water segment in the United States with its 2000 launch of Glacau Vitamin Water, which contained a variety of vitamins promoting mental stimulation, physical rejuvenation, and overall improved health. Glacau was the best-selling brand of enhanced water in 2000 and 2001, but it fell to the number two position in the segment upon PepsiCo's launch of Propel Fitness Water. Propel Fitness Water remained the market leader in the U.S. enhanced water segment in 2006. Energy Brands had achieved a compounded annual growth rate of more than 200 percent between 2000 and 2005 , to record estimated sales of $350 million and maintain its number two position in the U.S. functional water category. Coca-Cola, Nestl, and Danone Waters had begun testing vitamin-enhanced waters in as early as 2002 , but all three had changed their approaches to functional waters by 2006. Coke had given up on vitamin-enhanced waters in favor of flavored water, while Nestl Waters and Danone Waters retained only a fluoride-enhanced water. Like those at CocaCola, managers at Nestl and Danone believed that flavored waters offered substantial growth opportunities in most country markets. The Tata Group, an Indian beverage producer, showed greater confidence in the vitamin-enhanced bottled water market with its purchase of a 30 percent stake in Energy Brands in 2006 for $677 million. The Tata Group's chairman believed that Energy Brands had the potential to become a $3 billion company within 10 years. PROFILES OF THE LEADING BOTTLED WATER PRODUCERS Nestl Waters Nestle was the world's leading seller of bottled water, with a worldwide market share of 18.3 percent in 2006. It was also the world's largest food company, with 2005 sales of 91 billion Swiss francs (approximately $71 billion). The company was broadly diversified into 10 food and beverage categories that were sold in almost every country in the world under such recognizable brand names as Nescaf, Taster's Choice, Perrier, Vittel, Carnation, PowerBar, Friskies, Alpo, Nestea, Libby's, Stouffer's, and of course, Nestl. The company produced bottled water as early as 1843 , but its 1992 acquisition of Perrier created the foundation of what has made Nestl Waters the world's largest seller of bottled water, with 75 brands in 130 countries. In 2005, Nestl recorded bottled water sales of 8.8 billion Swiss francs (approximately $6.9 billion) and was the global leader in the bottled water industry, with an 18.3 percent worldwide market share in 2005. Nestl Waters was the number one seller of bottled water in the United States with a 42.1 percent market share in 2004 and the number one seller in Europe with a 20 percent market share. Nestl was also the number one seller in Africa and the Middle East and was aggressive in its attempts to build market-leading positions in emerging markets Asia and Latin America through the introduction return the carbon dioxide level to what was evident as the water emerged from the source. Even though sparkling water was very popular throughout most of Europe, where it accounted for approximately 54 percent of industry sales, it made up only 8 percent of the bottled water market in the United States. The FDA's definition of "mineral water" stated that such water must have at least 250 parts per million of total dissolved solids, and its standards required water labeled as "purified" to have undergone distillation, deionization, or reverse osmosis to remove chemicals such as chlorine and fluoride. "Drinking water" required no additional processing beyond what was required for tap water but could not include flavoring or other additives that account for more than 1 percent of the product's total weight. Both "drinking water" and "purified water" had to clearly state that the water originated "from a community water system" or "from a municipal source." Bottled water producers could also voluntarily become members of the International Bottled Water Association (IBWA) and agree to comply with its Model Code, which went beyond the standards of the EPA, FDA, or state agencies. The Model Code allowed fewer parts per million of certain organic and inorganic chemicals and microbiological contaminants than FDA, EPA, or state regulations and imposed a chlorine limitation on bottled water. Neither the FDA nor the EPA limited chlorine content. IBWA members were monitored for compliance through annual, unannounced inspections administered by an independent third-party organization. Distribution and Sale of Bottled Water Consumers could purchase bottled water in nearly any location in the United States where food was also sold. The distribution of bottled water varied depending on the producer and the distribution channel. Typically, bottled water was distributed to large grocers and wholesale clubs directly by the bottled water producer, whereas most producers used third parties like beer and wine distributors or food distributors to make sales and deliveries to convenience stores, restaurants, and delis. Because of the difficulty for food service distributors to restock vending machines and provide bottled water to special events, Coca-Cola and PepsiCo were able to dominate such channels since they could make deliveries of bottled water along with their deliveries of other beverages. Coca-Cola's and PepsiCo's vast beverage distribution systems made it easy for the two companies to make Dasani and Aquafina available anywhere Coke or Pepsi could be purchased. In addition, the two cola giants almost always negotiated contracts with sports stadiums, universities, and school systems that made one of them the exclusive supplier of all types of nonalcoholic beverages sold in the venue for a specified period. Under such circumstances, it was nearly impossible for other brands of bottled water to gain access to the account. PepsiCo and Coca-Cola's soft drink businesses had allowed vending machine sales to account for 8 percent of industry sales volume in 2005 and had also aided the two companies in making Aquafina and Dasani available in supermarkets, supercenters, wholesale clubs, and convenience stores. Soft drink sales were important to all types of food stores since soft drinks made up a sizable percentage of the store's sales and since food retailers frequently relied on soft drink promotions to generate store traffic. Coca-Cola and PepsiCo were able to encourage their customers to purchase items across their product lines to ensure prompt and complete shipment of key soft drink products. As a diversified food products company, PepsiCo had exploited the popularity of its soft drinks, Gatorade sports drinks, Frito-Lay snack foods, and Tropicana orange juice in persuading grocery accounts to purchase not only Aquafina but also other non-soft drink brands such as FruitWorks, SoBe, Lipton's Iced Tea, and Starbucks Frappuccino. Since most supermarkets, supercenters, and food stores usually carried fewer than seven branded bottled waters plus a private-label brand, bottled water producers other than Coke and Pepsi were required to compete aggressively on price to gain access to shelf space. Supermarkets and discount stores accounted for 43.5 percent of U.S. industry sales in 2005 and were able to require bottled water suppliers to pay slotting fees in addition to offering low prices to gain shelf space. Natural foods stores could also require annual contracts and slotting fees but were much more willing than traditional supermarkets to pay higher wholesale prices for products that could contribute to the store's overall level of differentiation. In fact, most natural foods stores would not carry brands found in traditional supermarkets. Convenience stores were also aggressive in pressing bottled water producers and food distributors for low prices and slotting fees. Most convenience stores carried only two to four brands of bottled water beyond what was distributed by Coca-Cola and Pepsi and required bottlers to pay annual slotting fees of $300 to $400 per store in return for providing 5 to 10 bottle facings on a cooler shelf. Some bottlers offered to provide retailers with rebates of approximately 25 cents per case to help secure distributors for their brand of bottled water. Food and beverage distributors usually allowed bottled water producers to negotiate slotting fees and rebates directly with convenience store buyers. There was not as much competition among bottled water producers to gain shelf space in delis and restaurants since that channel accounted for only 6.5 percent of U.S. industry sales in 2005. PepsiCo and Coca-Cola were among the better-suited bottled water producers to economically distribute water to restaurants since they likely provided fountain drinks to such establishments. Suppliers to the Industry The suppliers to the bottled water industry included municipal water systems; spring operators; bottling equipment manufacturers; deionization, reverse osmosis, and filtration equipment manufacturers; manufacturers of PET and HDPE bottles and plastic caps; label printers; and secondary packaging suppliers. Most packaging supplies needed for the production of bottled water were readily available from a large number of suppliers. Large bottlers able to commit to annual purchases of more than 5 million PET bottles could purchase bottles for as little as 5 cents per bottle, whereas regional bottlers purchasing smaller quantities of bottles or making only one-time purchases of bottles could expect to pay a much as 15 cents per bottle. Suppliers of secondary packaging like cardboard boxes, shrink-wrap, and six-pack rings and suppliers of printed film or paper labels were numerous and aggressively competed for the business of large bottled water producers. Bottling equipment used for water purification and filling bottles was manufactured and marketed by about 50 different companies in the United States. A basic bottle-filling line could be purchased for about $125,000, whereas a large state-of-the-art bottling facility could require a capital investment of more than $100 million. Bottlers choosing to sell spring water could expect to invest about $300,000 for source certification, road grading, and installation of pumping equipment, fencing, holding tanks, and disinfecting equipment. Bottlers that did not own springs were also required to enter into lease agreements with spring owners that typically ranged from $20,000 to $30,000 per year. Companies selling purified water merely purchased tap water from municipal water systems at industrial rates prior to purifying and bottling the water for sale to consumers. Sellers of purified water were able not only to pay less for water they bottled, but also to avoid spring water's inbound shipping costs of 5 to 15 cents per gallon since water arrived at the bottling facility by pipe rather than by truck. Key Competitive Capabilities in the Bottled Water Industry Bottled water did not enjoy the brand loyalty of soft drinks, beer, or many other food and beverage products but was experiencing some increased brand loyalty, with 10 to 25 percent of consumers looking for a specific brand and an additional two-thirds considering only a few brands acceptable. Because of the growing importance of brand recognition, successful sellers of bottled water were required to possess well-developed brand-building skills. Most of the industry's major sellers were global food companies that had built respected brands in soft drinks, dairy products, chocolates, and breakfast cereals prior to entering the bottled water industry. Bottled water sellers also needed to have efficient distribution systems to supermarket, wholesale club, and convenience store channels to be successful in the industry. It was imperative for bottled water distributors (whether direct store delivery by bottlers or delivery by third parties) to maximize the number of deliveries per driver since distribution included high fixed costs for warehouses, trucks, handheld inventory tracking devices, and labor. It was also critical for distributors and bottlers to provide on-time deliveries and offer responsive customer service to large customers in the highly price-competitive market. Price competition also mandated high utilization of largescale plants to achieve low production costs. Volume and market share were also key factors in keeping marketing expenses at an acceptable per-unit level. Exbibit 7 Value Chain Comparison for the Bottled Water Operations of Nestl, PepsiCo, and Coca-Cola Source: Goldman Sachs Global Equity Research as reported by Beverage World, April 2002. than shifting its focus to the manufacture of plastic containers, the company should enter markets for products typically sold in glass containers. Groupe Danone's diversification outside of glass containers began in 1969 when the company acquired EvianFrance's leading brand of bottled water. Throughout the 1970s and 1980s, Groupe Danone acquired additional food and beverage companies that produced beer, pasta, baby food, cereals, sauces, confectionery, dairy products, and baked goods. In 1997, the company slimmed its portfolio of businesses to dairy products, bottled water, and a baked goods division producing cereal, cookies, and snacks. In 2005, Groupe Danone was a leading global food company, with annual sales of 13 billion and was the world's largest producer of dairy products, the number two producer of cereal, cookies, and baked snacks, and the second largest seller of bottled water. The company had been the largest seller of bottled water by volume in 2005 but was displaced by Nestl in both terms of volume and dollar sales during 2006. Danone recorded worldwide bottled water sales of 3.4 billion in 2005. Among Groupe Danone's most important beverage brands were Evian, the world's leading brand of spring water, and Wahaha, the leading brand of bottled water in China. Each brand accounted for more than 1 billion in sales during 2005. During that year, 40 percent of Danone's bottled water sales originated in Europe, 47 percent were in China, and 13 percent were in emerging markets outside of Asia. Danone's local and regional brands held number one shares in many country markets such as Denmark, Germany, Spain, the United Kingdom, Poland, Indonesia, Mexico, and Morocco. Like Nestl, Danone had made a number of acquisitions of regional bottled water producers during the late 1990 s and early 2000 s. During 2002, Exhibit 4 U.S. Per Capita Consumption of Bottled Water, 1991-2005 (p) = premnary Source: Beverage Marketing Corporation as reported by the International Bottled Water Association, 2006. to comply with the provisions of the Safe Drinking Water Act Amendments of 2001.) Consumer concerns over the quality of drinking water in the United States emerged in 1993 when 400,000 residents of Milwaukee, Wisconsin, became ill with flulike symptoms and almost 100 immune-impaired residents died from waterborne bacterial infections. Throughout the 1990s and into the early 2000s, the media sporadically reported cases of municipal water contamination, such as in 2000 when residents of Washington, D.C., became ill after the city's water filtration process caused elevated levels of suspended materials in the water. Even though some consumers were concerned about the purity of municipal water, most consumers' complaints with tap water centered on the chemical taste of tap water that resulted from treatment processes that included the use of chlorine and other chemicals such as fluoride. In a tap-water tasting in Atlanta hosted by Southpoint Magazine, judges rated municipal water on taste and found some cities' waters very palatable. Water obtained from the municipal source in Memphis was said to have " a refreshing texture."However, othermunicipal systems did not fare as well with the judges - some of whom suggested Houston's water tasted "like a chemistry lab," while others said Atlanta's municipal water was akin to "a gulp of swimming pool water."' However, there were positive attributes to the chemicals added to tap water, as chlorine was necessary to kill any bacteria in the water and fluoride had contributed greatly to improved dental health in the United States. In addition, tap water had been shown to be no less healthy than bottled water in a number of independent studies, including a study publicized in Europe that was commissioned by the World Wide Fund for Nature and conducted by researchers at the University of Geneva. Bottled water producers in the United States were required to meet the standards of both the Environmental Protection Agency (EPA) and the U.S. Food and Drug Administration (FDA). Like all other food and beverage products sold in the United States, bottled water was subject to such food safety and labeling requirements as nutritional labeling provisions and general good manufacturing practices (GMPs). Bottled water GMPs were mandated under the 1962 Kefauver-Harris Drug Amendments to the Federal Food, Drug and Cosmetic Act of 1938 and established specifications for plant construction and design, sanitation, equipment design and construction, production and process controls, and record keeping. The FDA required bottled water producers to test at least weekly for the presence of bacteria and to test annually for inorganic contaminants, trace metals, minerals, pesticides, herbicides, and organic compounds. Bottled water was also regulated by state agencies that conducted inspections of bottling facilities and certification of testing facilities to ensure that bottled water was bottled under federal GMPs and was safe to drink. Bottled water producers were also required to comply with the FDA's Standard of Identity, which required bottlers to include source water information on their products' labels. Water labeled as "spring water" must have been captured from a borehole or natural orifice of a spring that naturally flows to the surface. "Artesian water" could be extracted from a confined aquifer (a water-bearing underground layer of rock or sand) where the water level stood above the top of the aquifer. "Sparkling water" was required to have natural carbonation as it emerged from the source, although carbonation could be added to Recent Trends in the Bottled Water Industry As the annual growth rate of bottled water sales in the United States slowed from double-digit rates, signs had begun to appear that price competition in the bottled water industry might mirror that of the carbonated soft drink industry. Fierce price competition could be expected to bring volume gains but result in flat or declining revenues for the bottled water industry. Coca-Cola, Nestl, and PepsiCo had avoided strong price competition through 2004, but during the first six months of 2005 all three of the industry's largest sellers began to offer considerable discounts on 12- and 24-bottle multipacks to boost unit volume. Exhibit 5 presents average U.S. retail prices for 24-bottle multipacks marketed by Nestl Waters, Coca-Cola, and PepsiCo between 2003 and the first six months of 2005 . The world's largest sellers of bottled water appeared to be positioning for industry maturity by purchasing smaller regional brands. Nestl had acquired bottled water producers and entered into joint ventures in Poland, Hungary, Russia, Greece, France, Turkey, Algeria, South Korea, Indonesia, and Saudi Arabia between 2000 and 2006. Danone Waters also made a number of acquisitions and entered into strategic alliances and joint ventures during the early 2000 s to increase penetration of selected emerging and developed markets. Danone and Nestl had long competed against each other in most country markets, but PepsiCo and Coca-Cola were also becoming global sellers of bottled water. Coca-Cola had used a joint venture with Danone Waters to increase its bottled water product line in the Lnited States beyond Dasani and acquired established brands in Europe and Australia to build strength in markets outside the United States. PepsiCo expanded into international markets for bottled water by allowing foreign bottling franchisees to license the Aquafina brand. The strategic maneuvering had created a more globally competitive environment in which the top sellers met each other in almost all of the world's markets and made it difficult for regional sellers to survive. Californiabased Palomar Mountain Spring Water was one of many casualties of intensifying competitive rivalry. Like many other independent bottled water companies launched in the 1990s, Palomar was forced into bankruptcy in 2003 after losing key supermarket and discount store contracts. After Palomar lost much of its distribution in California supermarkets and discount stores to Nestl, its 2003 revenues fell to $7 million from $30 million just two years earlier. Exhibit 6 illustrates the extent to which the U.S. bottled water market had consolidated by 2003 and 2004. The introduction of enhanced waters or functional waters was the most important product innovation since bottled water gained widespread acceptance in the United States, with most sellers in 2006 having introduced variations of their products that included flavoring, vitamins, carbohydrates, electrolytes, and other supplements. The innovation seemed to be a hit with U.S. consumers, as the market for enhanced bottled waters expanded from $20 million Exhibit 5 Average Retail Prices of Multipack Bottled Water Marketed by Nestl Waters, Coca-Cola, and PepsiCo, 2003-2005 of purified water. After its acquisition of Gemex, PepsiCo shifted its international expansion efforts to bringing Aquafina to selected emerging markets in Eastern Europe, the Middle East, and Asia. In 2006, Aquafina was the number one brand of bottled water in Russia and Vietnam and the number two brand in Kuwait. Other Sellers In addition to the industry's leading sellers of bottled water, there were hundreds of regional and specialty brands of bottled water in the United States. Most of these companies were privately held bottlers with distribution limited to small geographic regions that competed aggressively on price to make it onto convenience store and supermarket shelves as thirdtier brands. Many of these bottlers also sought out private-label contracts with discounters and large supermarket chains to better ensure full capacity utilization and to achieve sufficient volume to purchase bottles and other packaging at lower prices. CG Roxanne was the most successful privately owned bottled water company in the United States. The company's Crystal Geyer brand made it the fourth largest seller of bottled water in the United States in 2004 , with a 7.4 percent market share. Crystal Geyser competed at the lower price points in U.S. supermarkets and convenience stores and was bottled from springs in California, Tennessee, South Carolina, and New Hampshire. The company did not disclose its financial performance. Another group of small bottlers such as Fiji, Voss, Penta and Trinity Springs used differentiating features to avoid the fierce price competition at the low end of the market and sold in the superpremium segment, where bottled water retailed from $1.50 to $2.25 per 16-ounce PET container. Superpremium brands were most often sold in natural foods stores, with Trinity Springs being among the leaders in the channel in 2005. Trinity's differentiation was based on its water source, which was a 2.2-mile-deep artesian well located in the Trinity Mountains of Idaho. Trinity Springs' distribution halted in March 2006 when a court invalidated the 2004 sale of the company to Amcon Distributing. Amcon, which had lost $2 million in fiscal 2005 and another \$1.8 million during the first six months of fiscal 2006, shut down its Trinity Springs water division after the ruling and was negotiating a settlement with Trinity Springs shareholders in late 2006. Penta's differentiation was based on a proprietary purification system that the company claimed removed 100 percent of impurities from tap water. The company had also built brand recognition through product placements in motion pictures, music videos, and more than 25 television series. Penta also sponsored a large number of triathlons across the United States and was endorsed by a wide variety of entertainers and professional athletes. In 2006, Penta was distributed in more than 5,000 health food stores in the United States. Penta was also available in Australia, Japan, the United Kingdom, and Canada. Fiji was also among the best-selling brands of superpremium water sold in natural foods stores in 2006 but was also sold in many supermarkets, convenience stores. and drugstores across the United States. Like Penta, Fiji received considerable exposure from its placement in network television series and motion pictures. Voss achieved differentiation not only from the purity of its source in Norway but also through its distinctive glass bottle and limited channels of distribution. The brand was available only in the most exclusive hotels, spas, and resorts. Another superpremium brand. Eon, achieved its differentiation through its anti-aging claims. The company's antiaging properties were said to result from the basic atomic structure of Eon water, which was altered through a proprietary reverse osmosis technology. The structure of Eon was similar to that naturally occurring in snowflakes and glacier ice and was suggested to improve cellular hydration and cell detoxification properties better than unstructured water. Many other superpremium brands of bottled water were sold in the Lnited States during 2006, with each attempting to support its premium pricing with some unique characteristic. 4-million-bottle sampling campaign but voluntarily recalled all Dasani bottles from retailers' shelves just two weeks after the launch. The recall was predicated on test results performed by the company that indicated the bottles were tainted with bromate - a cancer-causing agent. Bromate became introduced to the product when calcium, a mandatory ingredient for bottled waters sold in the United Kingdom, was added to Coca-Cola's proprietary formula of minerals used to distinguish Dasani from other bottled waters. The bromate levels present in Dasani exceeded regulatory limits in the United Kingdom but met standards for purity on the European continent. Nevertheless, Coke management believed it best to recall the product and discontinue immediate plans to distribute Dasani not only in the United Kingdom but also in all other European markets. The Dasani launch was viewed by many in the business press as one of the all-time great marketing disasters and resulted in Coke's abandoning the Dasani brand in Europe. CocaCola management announced during a June 2006 Deutsche Bank conference for consumer goods that it would expand its line of noncarbonated beverages in Europe through acquisitions. Within two weeks of the announcement, Coca-Cola had acquired the Italian mineral water company Fonti del Vulture and the Apollinaris mineral water brand sold in Germany by Orangina. Coca-Cola also acquired two HOD bottled water producers in Australia during 2006. PepsiCo Inc. In 2006, PepsiCo was the world's fourth largest food and beverage company, with sales of approximately $32 billion. The company's brands were sold in more than 200 countries and included such well-known names as Lay's, Tostitos, Mountain Dew, Pepsi, Doritos, Lipton Iced Tea, Gatorade, Quaker, and Cracker Jack. Six of PepsiCo's products were among the top-15 largest selling products sold in U.S. supermarkets. PepsiCo also produced and marketed Aquafina - the best-selling brand of bottled water in the United States between 2002 and 2006. PepsiCo had made attempts to enter the bottled water market in as early as 1987 , when it purchased a spring water company, but its attempts were unsuccessful until its 1997 introduction of Aquafina. After experimenting with spring water and sparkling water for several years, Pepsi management believed it would be easier to produce a national brand of bottled water that could utilize the same water purification facilities in Pepsi bottling plants that were used to produce the company's brands of soft drinks. Pepsi management also believed that the company could distinguish its brand of purified bottled water from competing brands by stripping all chlorine and other particles out of tap water that might impart an unpleasant taste or smell. PepsiCo began testing a filtration process for Aquafina in 1994 when it installed \$3 million worth of reverse osmosis filtration equipment in its Wichita, Kansas, bottling plant to further purify municipal water used to make soft drinks. The system pushed water through a fiberglass membrane at very high pressure to remove chemicals and minerals before further purifying the water using carbon filters. The water produced by Pepsi's process was so free of chemicals that the company was required to add ozone gas to the water to prevent bacteria growtl. Since the company's introduction of Aquafina, Pepsico had expanded its water brands in the Lnited States to include Gatorade Propel Fitness Water, SoBe Life Water, and functional versions of Aqualina. The product lines for its water business were developed around customer type and lifestyle. Propel was a flavor- and vitamin-enriched water marketed to physically active consumers, while Life Water was a vitamin-enhanced water similar to Glacau Vitamin Water in formulation and packaging that was marketed to image-driven consumers. The company targeted mainstream water consumers with unflavored Aquafina, Aquafina FlavorSplash (offered in four flavors), and Aquafina Sparkling (a zero-calorie, lightly carbonated citrus or berryfiavored water). Aquafina Alive, planned for a 2007 launch, included vitamins and natural fruit juices. The company's strategy involved offering a continuum of healthy beverages from unflavored Aquafina to nutrient-rich Gatorade. In 2006, Gatorade, Propel, and Aquafina were all number one in their categories, with market shares of 80 percent, 34 percent, and approximately 14 percent, respectively. PepsiCo was slowly moving into international bottled water markets, with its most notable effort occurring in Mexico. In 2002, PepsiCo's bottling operations acquired Mexico's largest Pepsi bottler, Pepsi-Gemex SA de CV, for $1.26 billion. Gemex not only bottled and distributed Pepsi soft drinks in Mexico but also was Mexico's number one producer Exbibit 2 Per Capita Consumption of Bottled Water by Country Market, 1999, 2004 * CAGR = compound annual growth rate Source: Beverage Marketing Corporation as reported by the International Bottled Water Association, 2006. Exhibit 3 Global Bottled Water Market Wholesale Value and Volume, 2001-2005, Forecasts for 20062010
Step by Step Solution
There are 3 Steps involved in it

Get step-by-step solutions from verified subject matter experts