

Question: Use the following spreadsheet to work Problems . The spreadsheet provides data on oil and gasoline: Column A is the year, column B is the
Use the following spreadsheet to work Problems . The spreadsheet provides data on oil and gasoline: Column A is the year, column B is the price of oil (dollars per barrel), column C is the price of gasoline (cents per gallon), column D is U.S. oil production, and column E is the U.S. quantity of gasoline refined.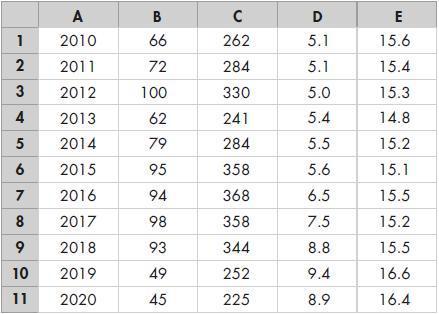
Draw a scatter diagram of the quantity of U.S. oil produced and the quantity of gasoline refined. Describe the relationship.
A 2010 1 2 2011 3 2012 4 5 6 7 8 2017 9 2018 10 2019 11 2020 2013 2014 2015 2016 B 66 72 100 62 79 95 94 98 93 49 45 262 284 330 241 284 358 368 358 344 252 225 D 5.1 5.1 5.0 5.4 5.5 5.6 6.5 7.5 8.8 9.4 8.9 E 15.6 15.4 15.3 14.8 15.2 15.1 15.5 15.2 15.5 16.6 16.4
Step by Step Solution
3.24 Rating (159 Votes )
There are 3 Steps involved in it
I can guide you through the process of creating a scatter diagram and describe the hypothetical rela... View full answer

Get step-by-step solutions from verified subject matter experts