

Question: Use the following data to work Problems. Draw a graph that shows the relationship between the two variables x and y: a. Is the relationship
Use the following data to work Problems. Draw a graph that shows the relationship between the two variables x and y: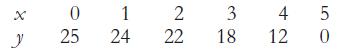
a. Is the relationship positive or negative?
b. Does the slope of the relationship become steeper or flatter as the value of x increases?
c. Think of some economic relationships that might be similar to this one.
0 1 25 24 2 22 3 4 18 12 5 0
Step by Step Solution
★★★★★
3.56 Rating (153 Votes )
There are 3 Steps involved in it
1 Expert Approved Answer
Step: 1 Unlock

Based on the data youve provided Ill walk you through how to approach these questions step by step a ... View full answer
Question Has Been Solved by an Expert!
Get step-by-step solutions from verified subject matter experts
Step: 2 Unlock
Step: 3 Unlock