

Figure 4-1 shows the estimated real and nominal rates for three-month U.S. treasury bills. Go to www.martincapital.com/main/charts.html
Question:
Figure 4-1 shows the estimated real and nominal rates for three-month U.S. treasury bills. Go to www.martincapital.com/main/charts.html and click on the relevant link under Charts of Interest Rates and Yields.
Figure 4-1
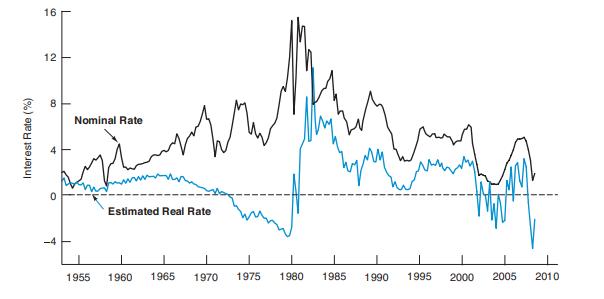
a. Compare the three-month real rate to the long-term real rate. Which is greater?
b. Compare the short-term nominal rate to the long-term nominal rate. Which appears most volatile?
Fantastic news! We've Found the answer you've been seeking!
Step by Step Answer:
Based on the graph provided which represents the interest rates over time from 1955 to shortly after 2010 we can make comparisons between the real and ...View the full answer

Answered By
John Kimutai
I seek to use my competencies gained through on the job experience and skills learned in training to carry out tasks to the satisfaction of users. I have a keen interest in always delivering excellent work
11+ Reviews
24+ Question Solved
Related Book For 
The Economics Of Money Banking And Financial Markets
ISBN: 9780321584717
4th Canadian Edition
Authors: Frederic S. Mishkin, Apostolos Serletis
Question Posted:
