

Consider the information in the following table for the first two years of the Great Depression (where
Question:
Consider the information in the following table for the first two years of the Great Depression (where the values for real GDP and potential GDP are in 2012 dollars).
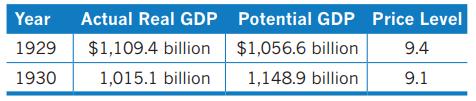
a. The table shows that something happened during 1929–1930 that has not happened during the recessions of the past 50 years. What is it?
b. Draw a dynamic aggregate demand and aggregate supply graph to illustrate what happened during these years. Your graph should contain the AD, SRAS, and LRAS curves for both 1929 and 1930 and should indicate the short-run macroeconomic equilibrium for each year and the directions in which the curves shifted.
Fantastic news! We've Found the answer you've been seeking!
Step by Step Answer:
a The table shows that real GDP fell by more than 4 between 1929 and 1930 even though the price level fell by only 35 This is something that has not h...View the full answer

Answered By
Muhammad Umair
I have done job as Embedded System Engineer for just four months but after it i have decided to open my own lab and to work on projects that i can launch my own product in market. I work on different softwares like Proteus, Mikroc to program Embedded Systems. My basic work is on Embedded Systems. I have skills in Autocad, Proteus, C++, C programming and i love to share these skills to other to enhance my knowledge too.
1+ Reviews
10+ Question Solved
Related Book For 

Question Posted:
