

The following graph illustrates the average total cost curves for two automobile manufacturing firms: Little Auto and
Question:
The following graph illustrates the average total cost curves for two automobile manufacturing firms: Little Auto and Big Auto. Under which of the following conditions would you expect to see the market composed of firms like Little Auto, and under which conditions would you expect to see the market dominated by firms like Big Auto?
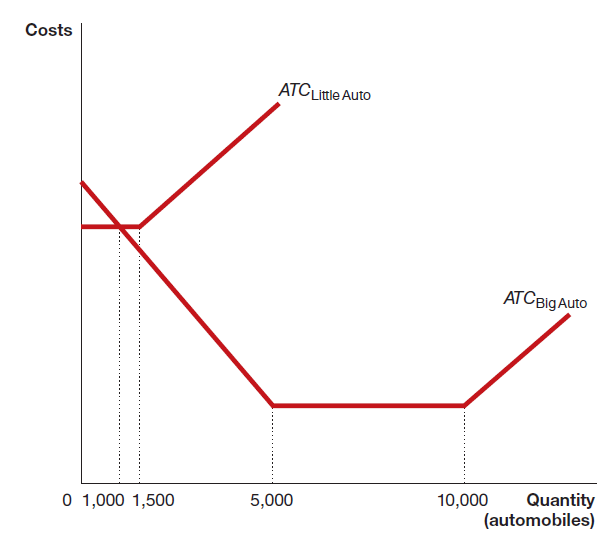
a. When the market demand curve intersects the quantity axis at fewer than 1,000 units.
b. When the market demand curve intersects the quantity axis at more than 1,000 units but fewer than 10,000 units.
c. When the market demand curve intersects the quantity axis at more than 10,000 units.
Fantastic news! We've Found the answer you've been seeking!
Step by Step Answer:
The position of the market demand curve plays a critical role in this market because market demand d...View the full answer

Answered By
Charles mwangi
I am a postgraduate in chemistry (Industrial chemistry with management),with writing experience for more than 3 years.I have specialized in content development,questions,term papers and assignments.Majoring in chemistry,information science,management,human resource management,accounting,business law,marketing,psychology,excl expert ,education and engineering.I have tutored in other different platforms where my DNA includes three key aspects i.e,quality papers,timely and free from any academic malpractices.I frequently engage clients in each and every step to ensure quality service delivery.This is to ensure sustainability of the tutoring aspects as well as the credibility of the platform.
2+ Reviews
10+ Question Solved
Related Book For 

Question Posted:
